Resideline Blog
Real Estate Investing Blog
Valuation deep dives, product updates, and live market reads across 2,275 local housing markets. Written by the team building a publicly graded home valuation model.
Latest
Where Are Home Prices Falling in 2026? 25 States Ranked by the Data
Is It a Buyer's Market Right Now? Price Cuts and Days to Sell (2026)
How to Comp a House: A Practical Guide to Real Estate Comps
Safest Counties by State: 37 States Ranked (2026)
Market Watch
Sold-price reads on 2,275 local housing markets. Updated October 4, 2026.
Guides & product
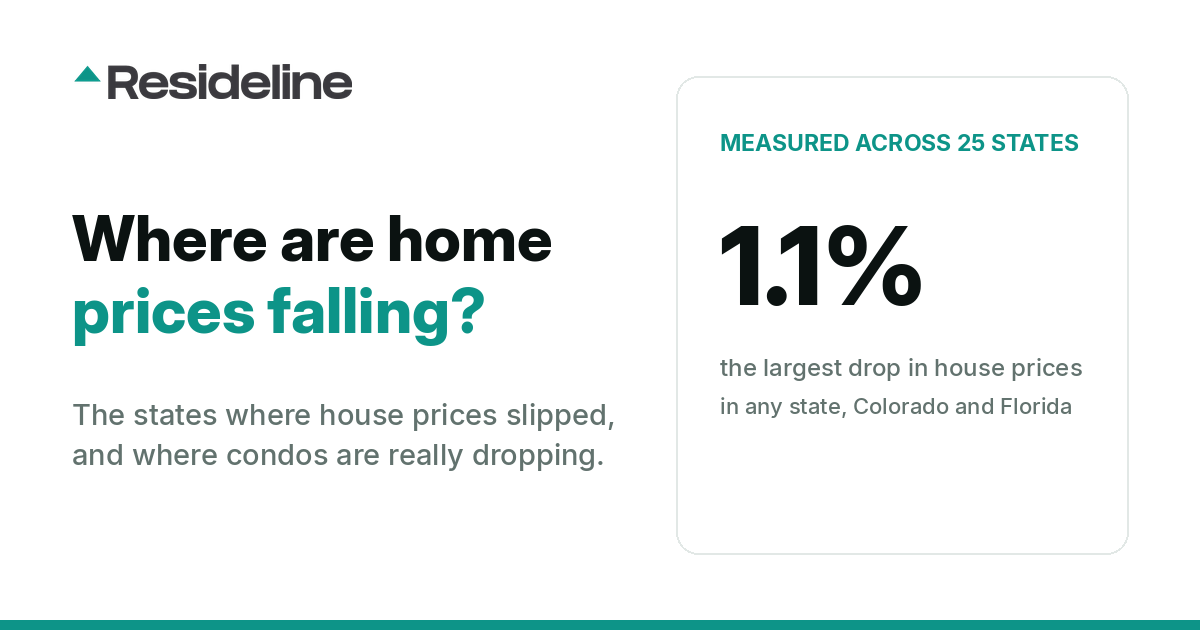
Where Are Home Prices Falling in 2026? 25 States Ranked by the Data
Despite the crash talk, no state's same-home house prices fell by more than 1.1 percent in the first half of 2026. Here is the map and the 25-state ranking, built from the closed sales we track, plus where condo prices really are dropping.
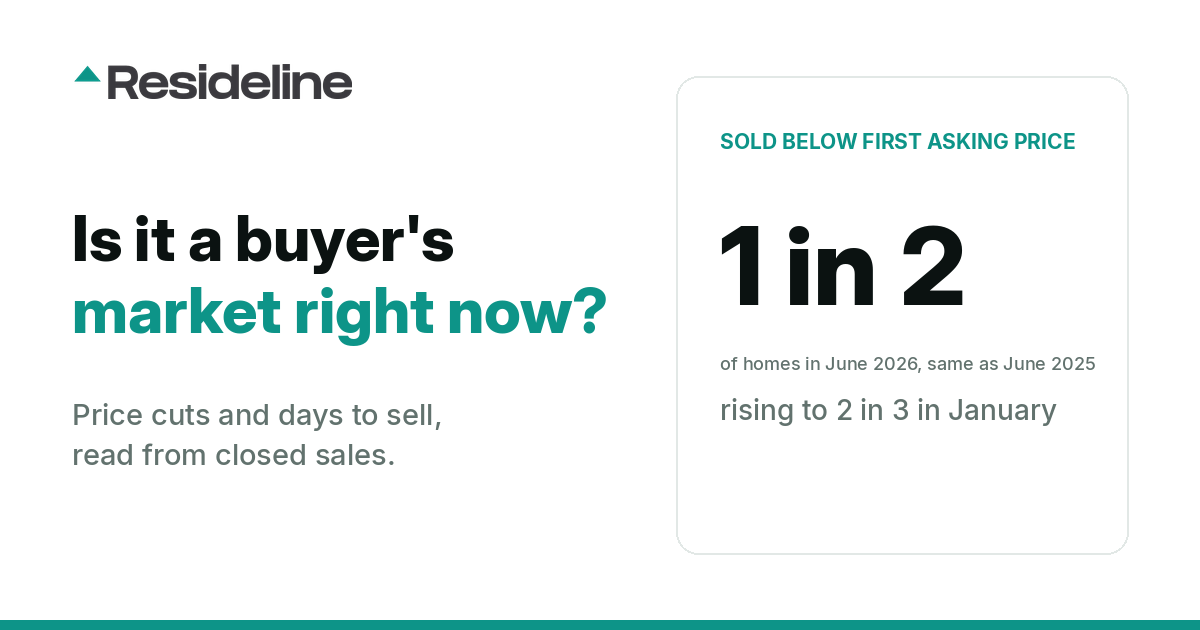
Is It a Buyer's Market Right Now? Price Cuts and Days to Sell (2026)
More than half of homes sell below their original asking price, but that is not new: it was just as true a year ago. What changes is the season, and the state. Here is what closed sales show about negotiating room in 2026.

How to Comp a House: A Practical Guide to Real Estate Comps
How to run comparable sales properly: which sales count, how recent and how close they have to be, how many you need, and the adjustments worth making, with the price spread measured across 2,235 US markets.
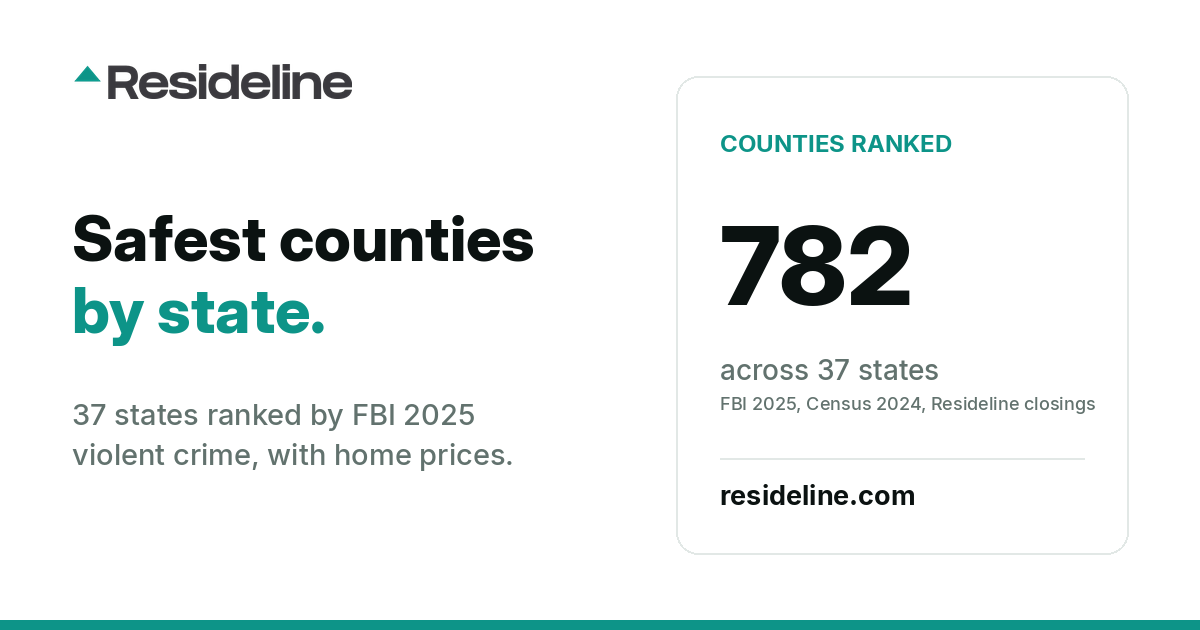
Safest Counties by State: 37 States Ranked (2026)
The safest counties in 37 US states, ranked by the violent crime rate their police agencies reported to the FBI for 2025, with home prices, rents and incomes where available.
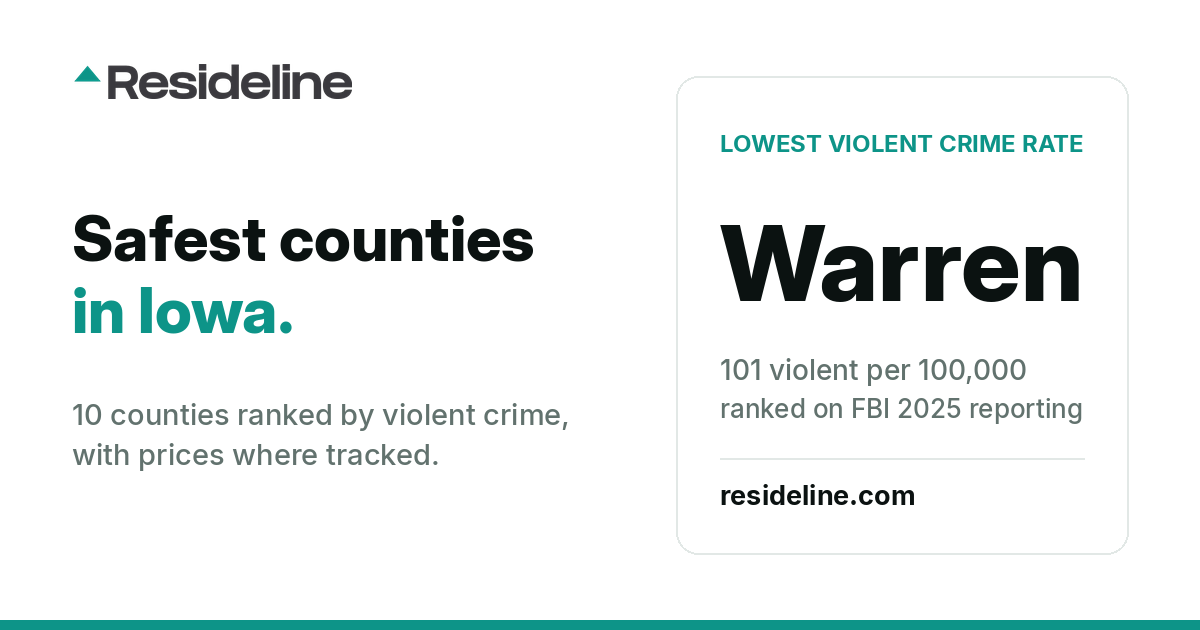
Safest Counties in Iowa: 10 Ranked (2026)
The 10 Iowa counties where police report enough to the FBI to build a reliable rate, ranked by violent crime, with home prices, asking rents and incomes where available.
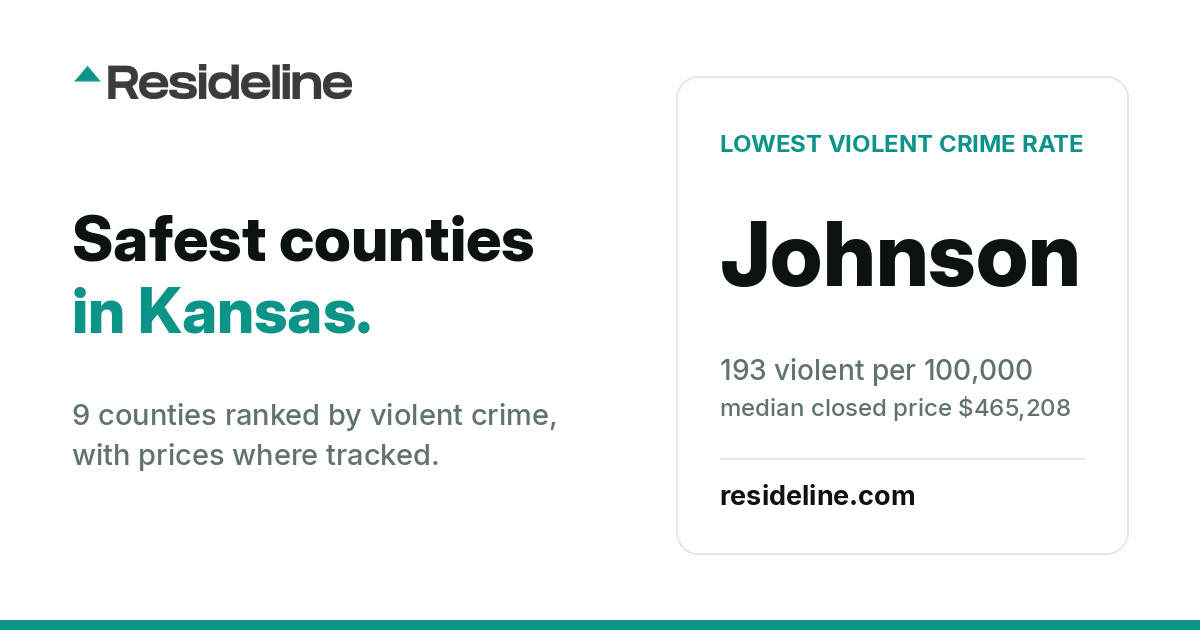
Safest Counties in Kansas: 9 Ranked (2026)
The 9 Kansas counties where police report enough to the FBI to build a reliable rate, ranked by violent crime, with home prices, asking rents and incomes where available.
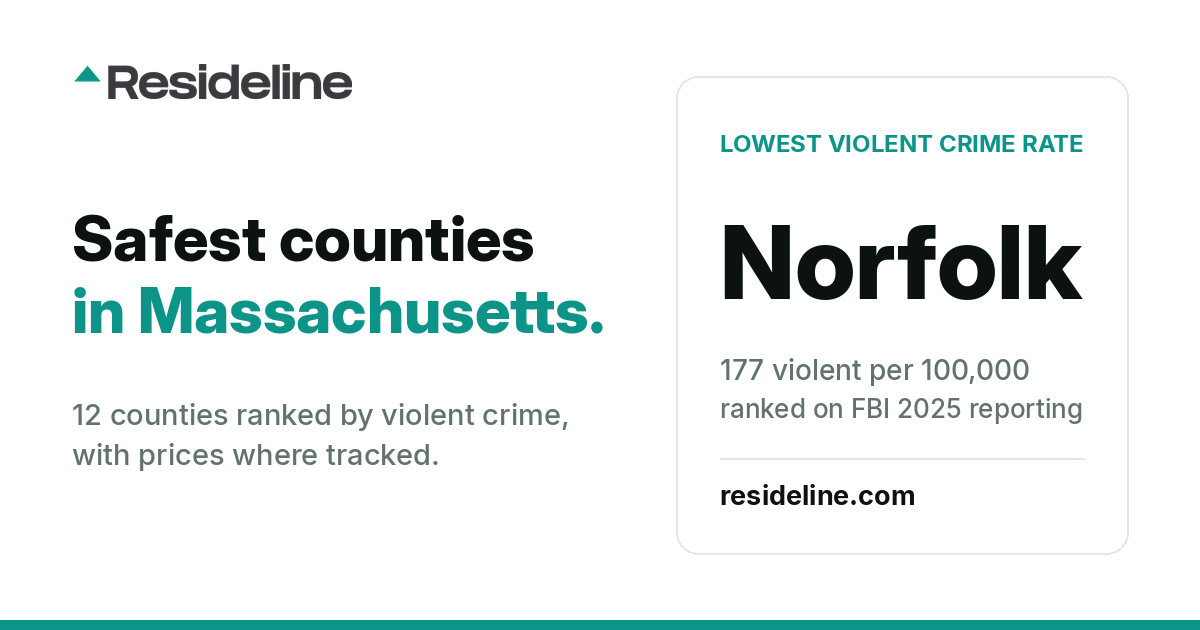
Safest Counties in Massachusetts: 12 Ranked (2026)
The 12 Massachusetts counties where police report enough to the FBI to build a reliable rate, ranked by violent crime, with home prices, asking rents and incomes where available.
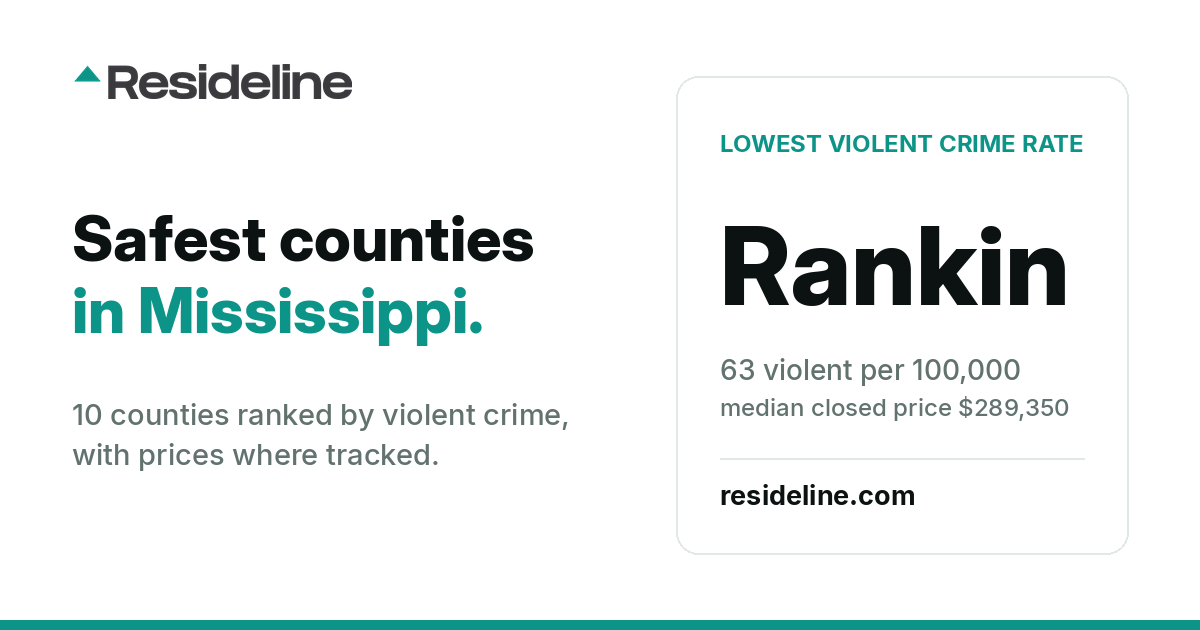
Safest Counties in Mississippi: 10 Ranked (2026)
The 10 Mississippi counties where police report enough to the FBI to build a reliable rate, ranked by violent crime, with home prices, asking rents and incomes where available.
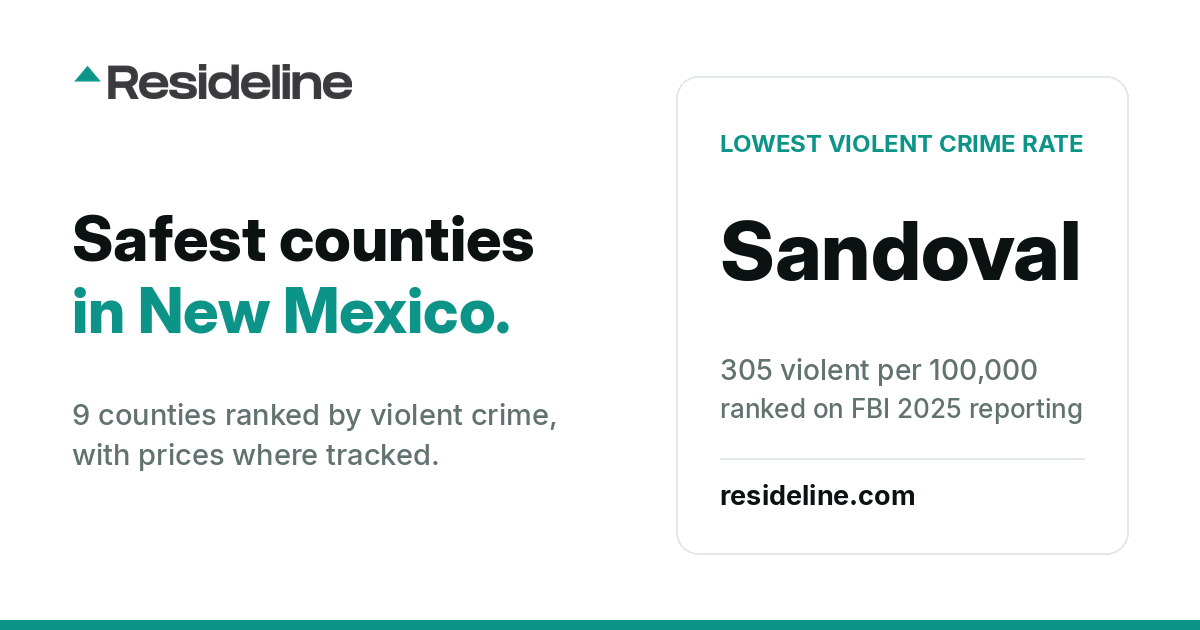
Safest Counties in New Mexico: 9 Ranked (2026)
The 9 New Mexico counties where police report enough to the FBI to build a reliable rate, ranked by violent crime, with home prices, asking rents and incomes where available.
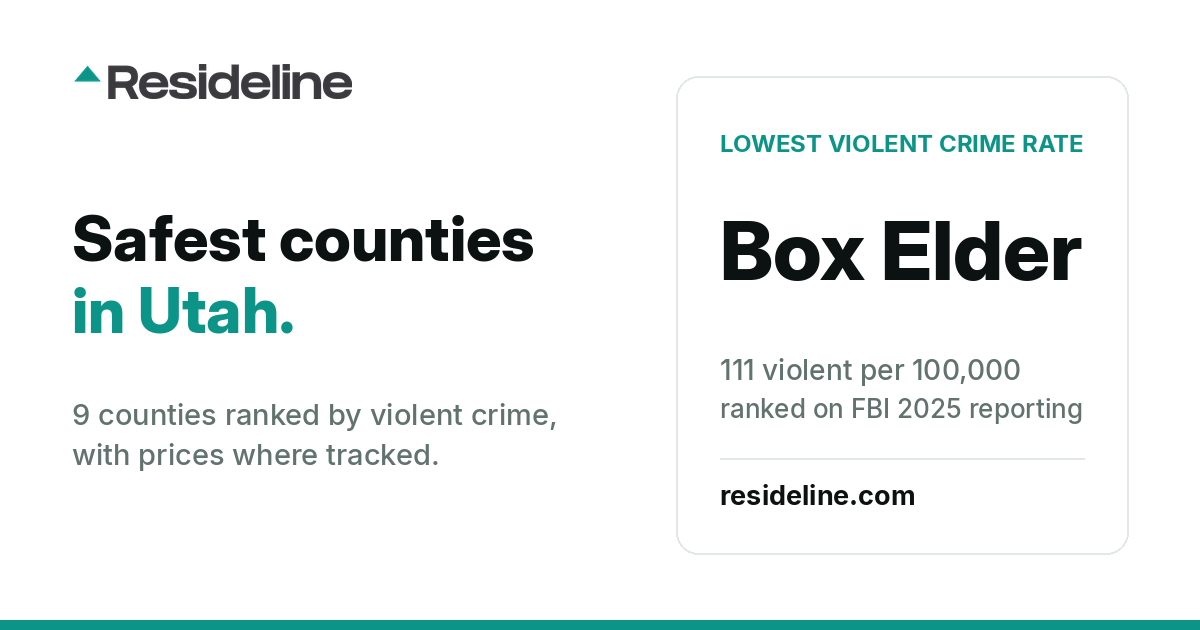
Safest Counties in Utah: 9 Ranked (2026)
The 9 Utah counties where police report enough to the FBI to build a reliable rate, ranked by violent crime, with home prices, asking rents and incomes where available.
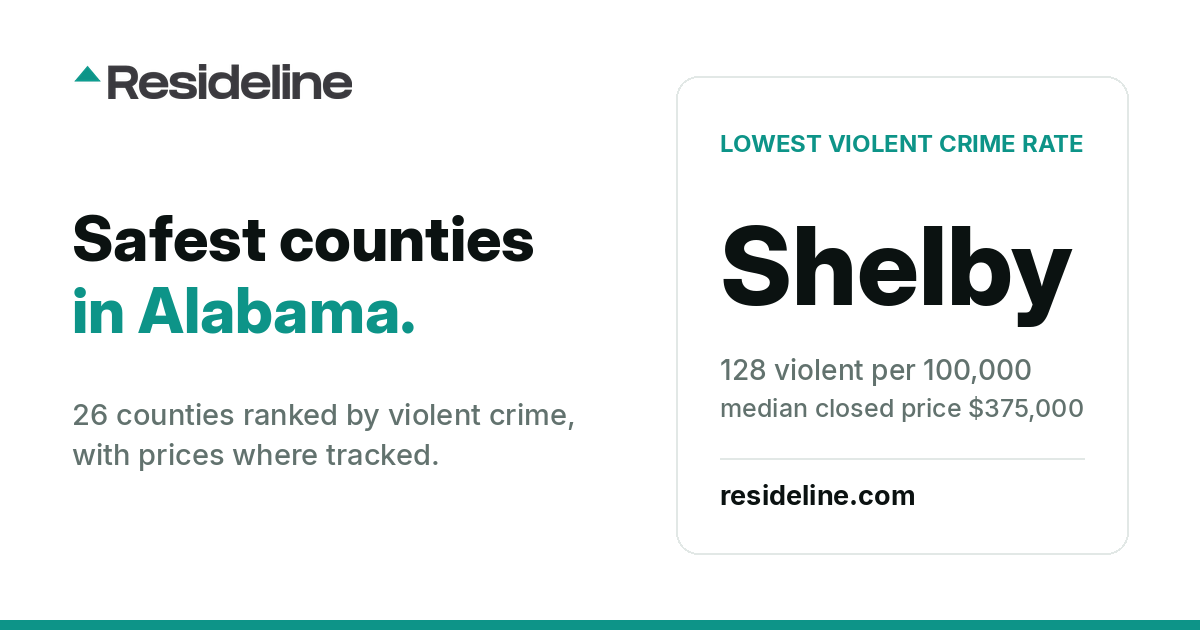
Safest Counties in Alabama: 26 Ranked (2026)
The 26 Alabama counties where police report enough to the FBI to build a reliable rate, ranked by violent crime, with home prices, asking rents and incomes where available.
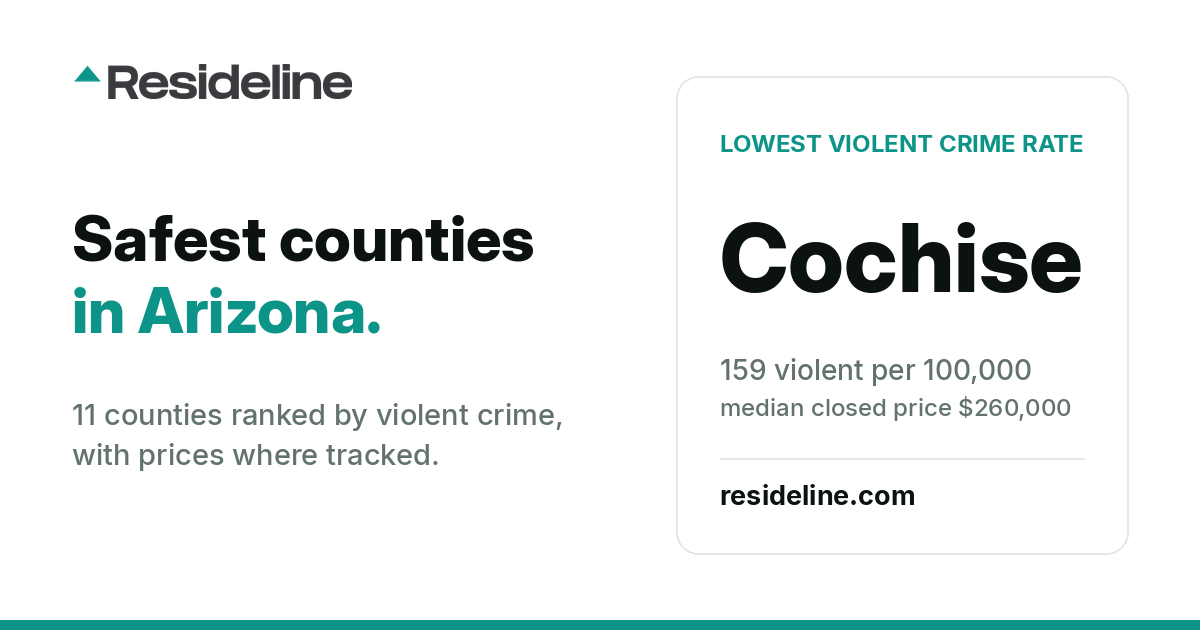
Safest Counties in Arizona: 11 Ranked (2026)
The 11 Arizona counties where police report enough to the FBI to build a reliable rate, ranked by violent crime, with home prices, asking rents and incomes where available.
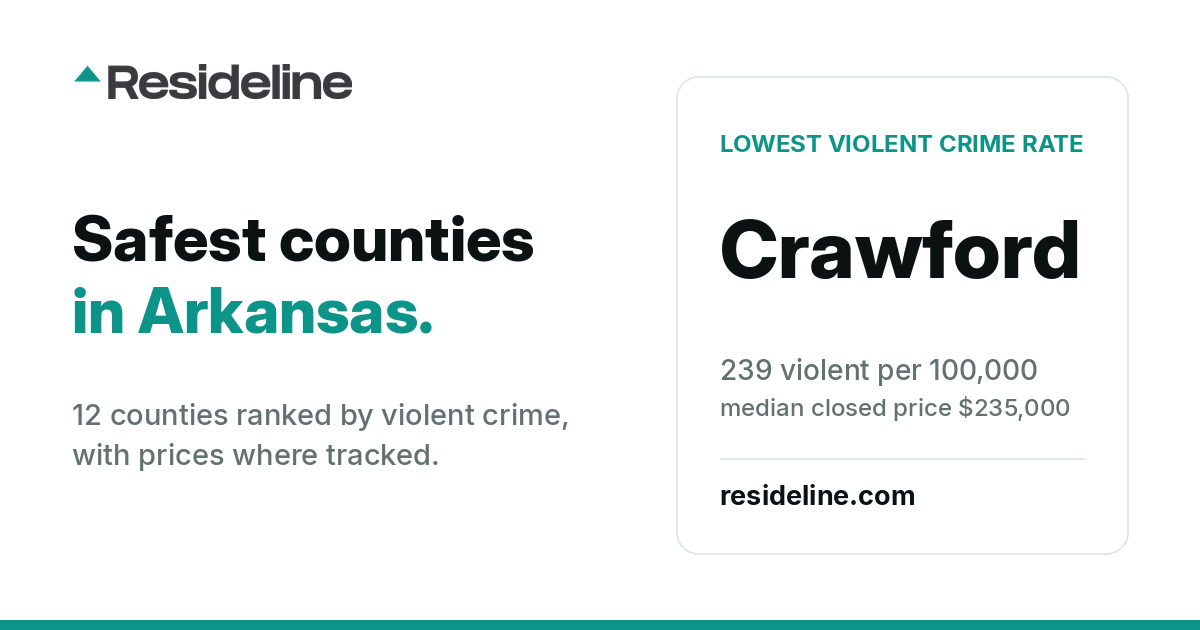
Safest Counties in Arkansas: 12 Ranked (2026)
The 12 Arkansas counties where police report enough to the FBI to build a reliable rate, ranked by violent crime, with home prices, asking rents and incomes where available.
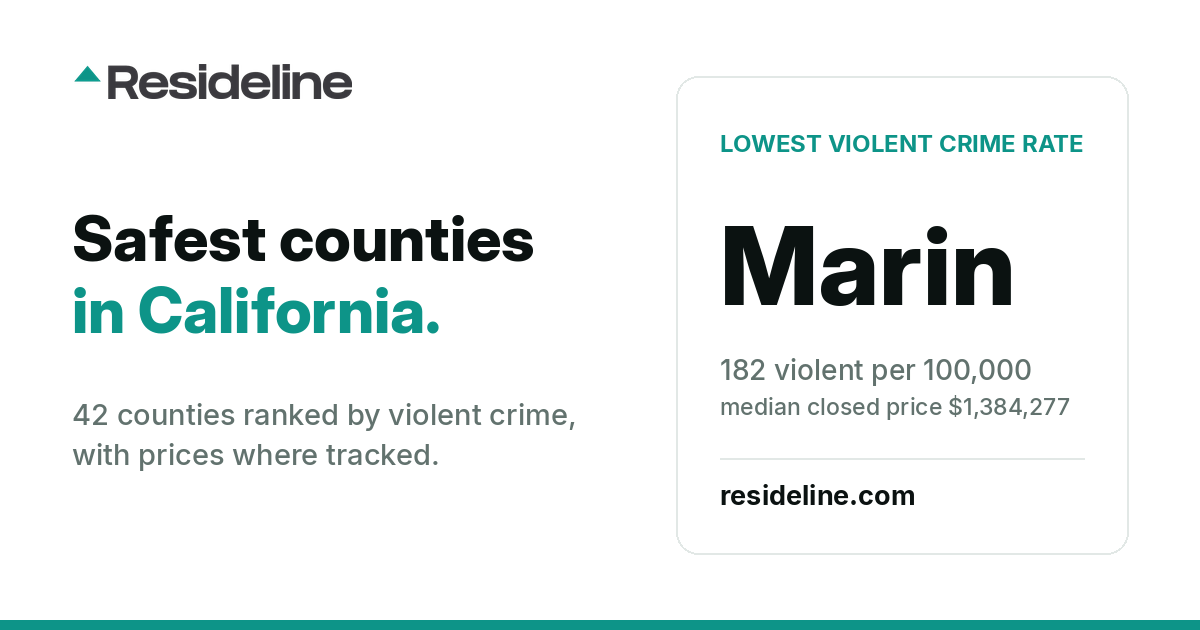
Safest Counties in California: 42 Ranked (2026)
The 42 California counties where police report enough to the FBI to build a reliable rate, ranked by violent crime, with home prices, asking rents and incomes where available.
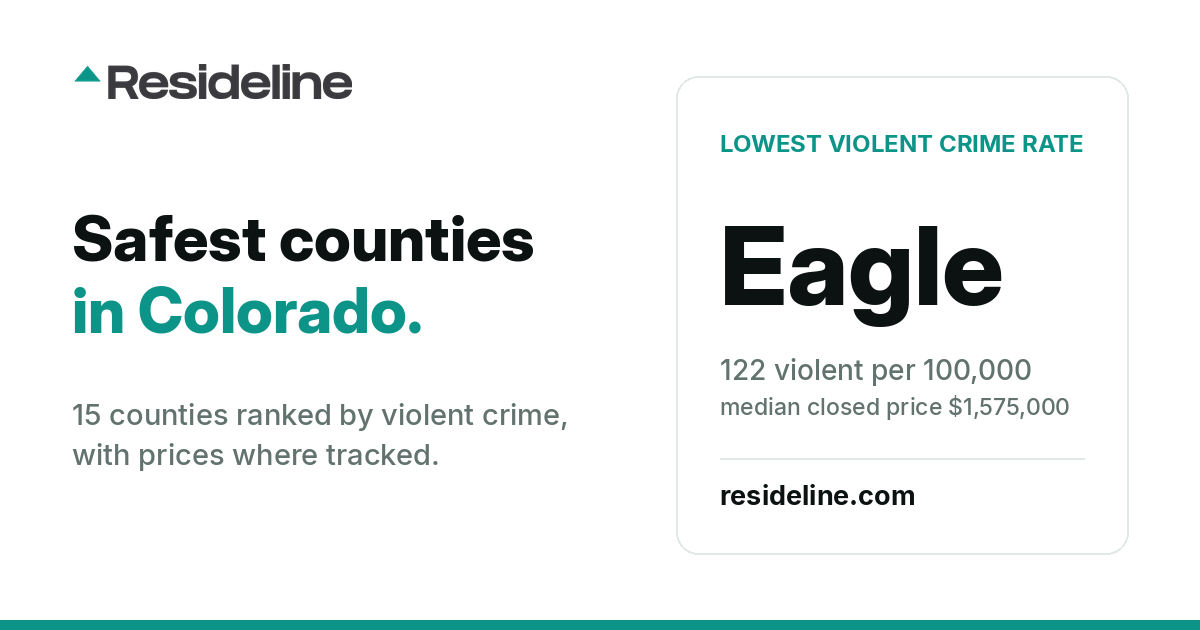
Safest Counties in Colorado: 15 Ranked (2026)
The 15 Colorado counties where police report enough to the FBI to build a reliable rate, ranked by violent crime, with home prices, asking rents and incomes where available.
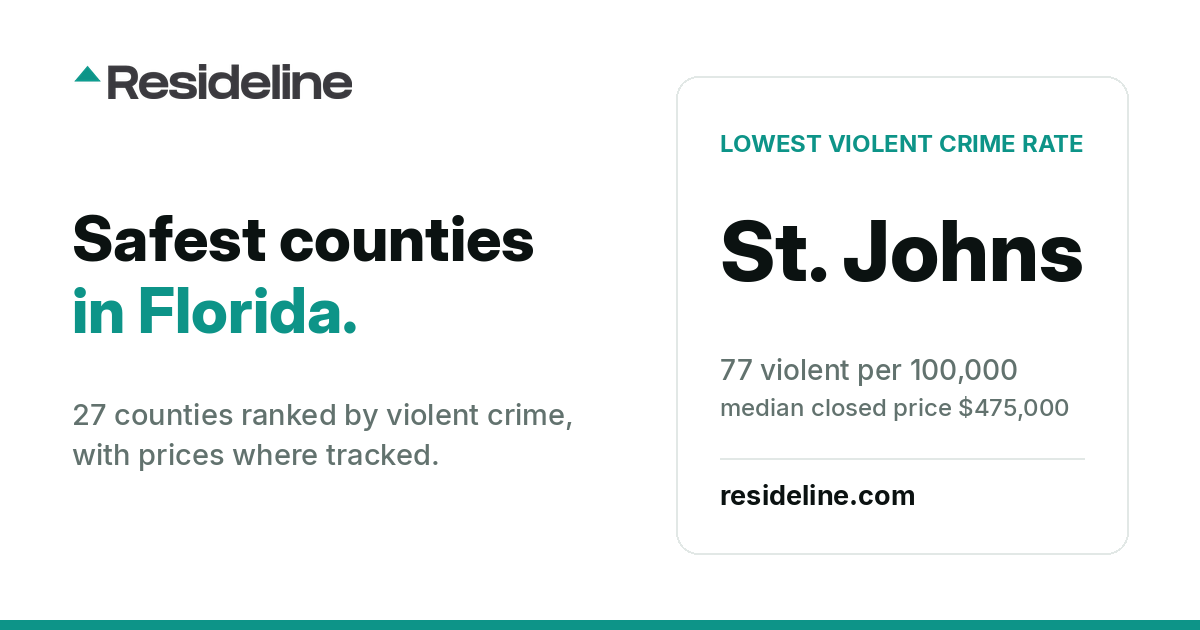
Safest Counties in Florida: 27 Ranked (2026)
The 27 Florida counties where police report enough to the FBI to build a reliable rate, ranked by violent crime, with home prices, asking rents and incomes where available.
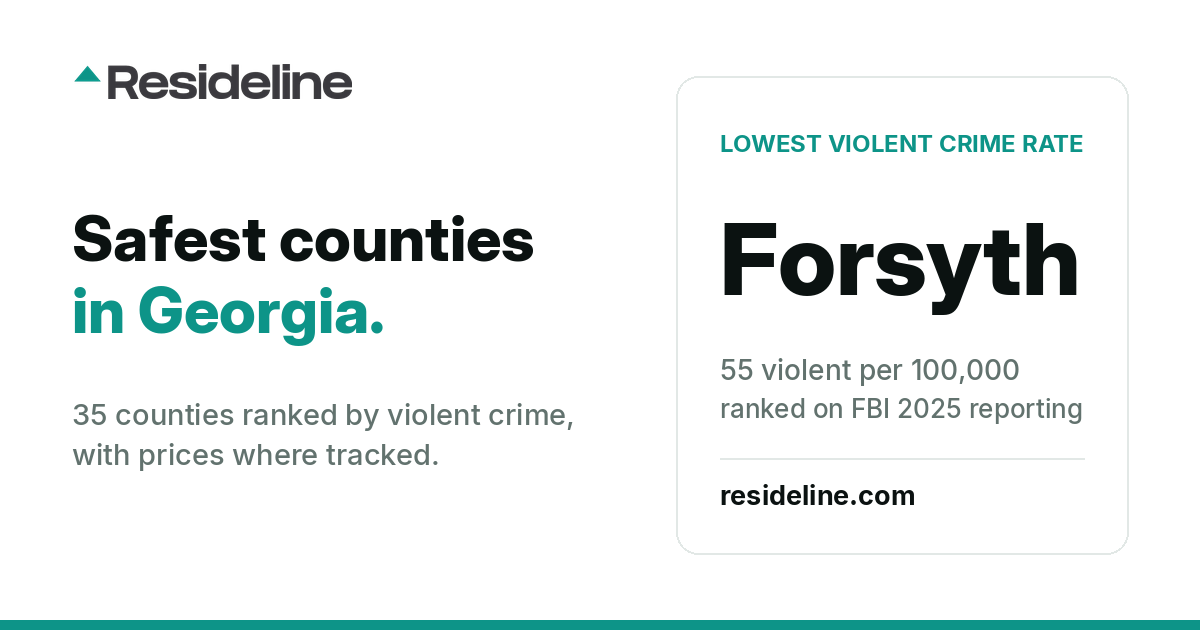
Safest Counties in Georgia: 35 Ranked (2026)
The 35 Georgia counties where police report enough to the FBI to build a reliable rate, ranked by violent crime, with home prices, asking rents and incomes where available.
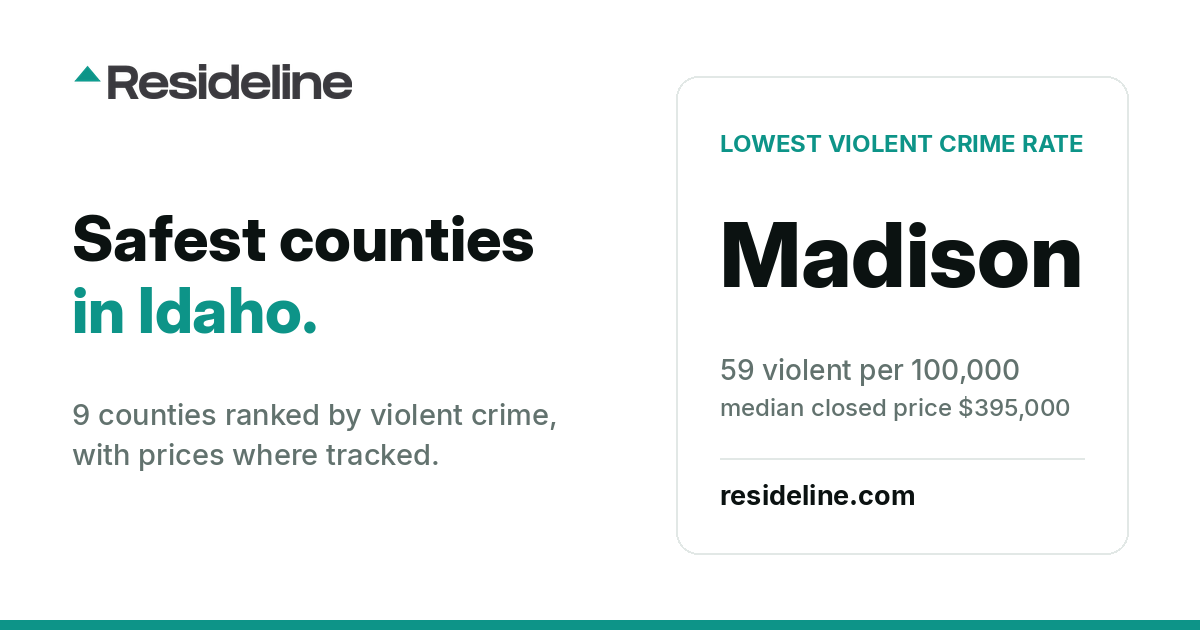
Safest Counties in Idaho: 9 Ranked (2026)
The 9 Idaho counties where police report enough to the FBI to build a reliable rate, ranked by violent crime, with home prices, asking rents and incomes where available.
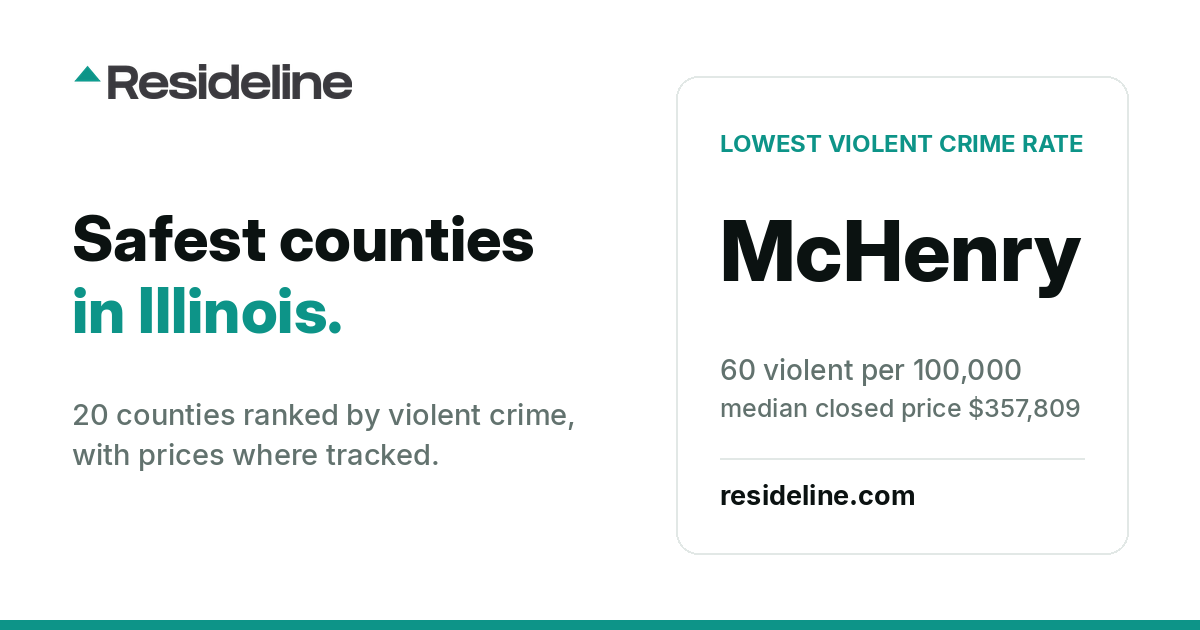
Safest Counties in Illinois: 20 Ranked (2026)
The 20 Illinois counties where police report enough to the FBI to build a reliable rate, ranked by violent crime, with home prices, asking rents and incomes where available.
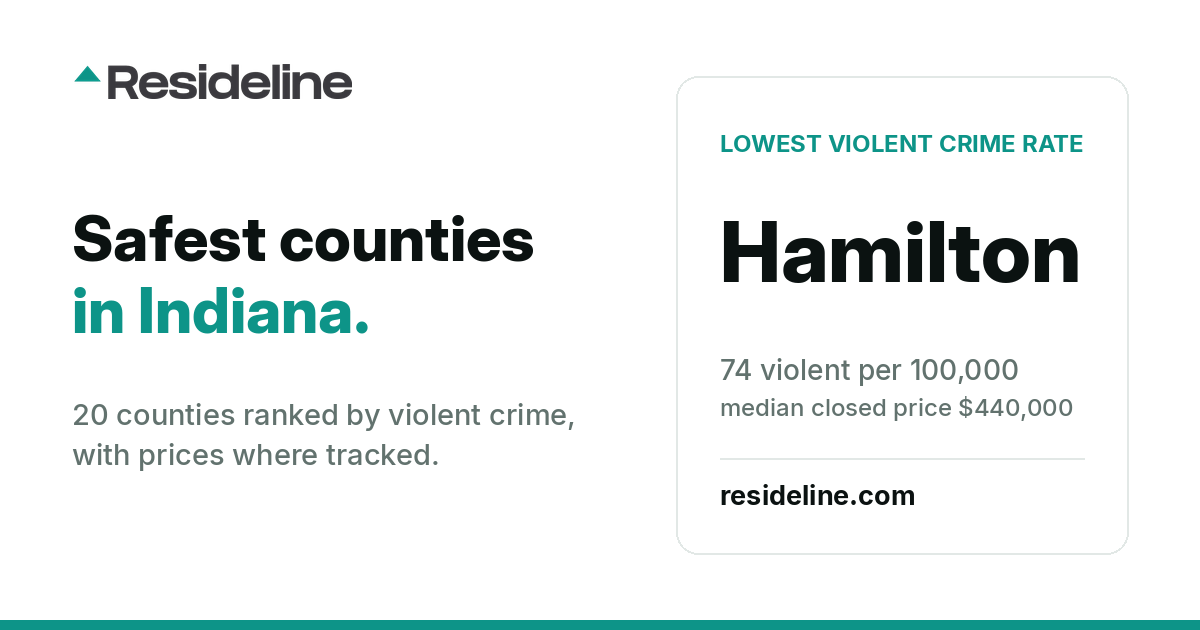
Safest Counties in Indiana: 20 Ranked (2026)
The 20 Indiana counties where police report enough to the FBI to build a reliable rate, ranked by violent crime, with home prices, asking rents and incomes where available.
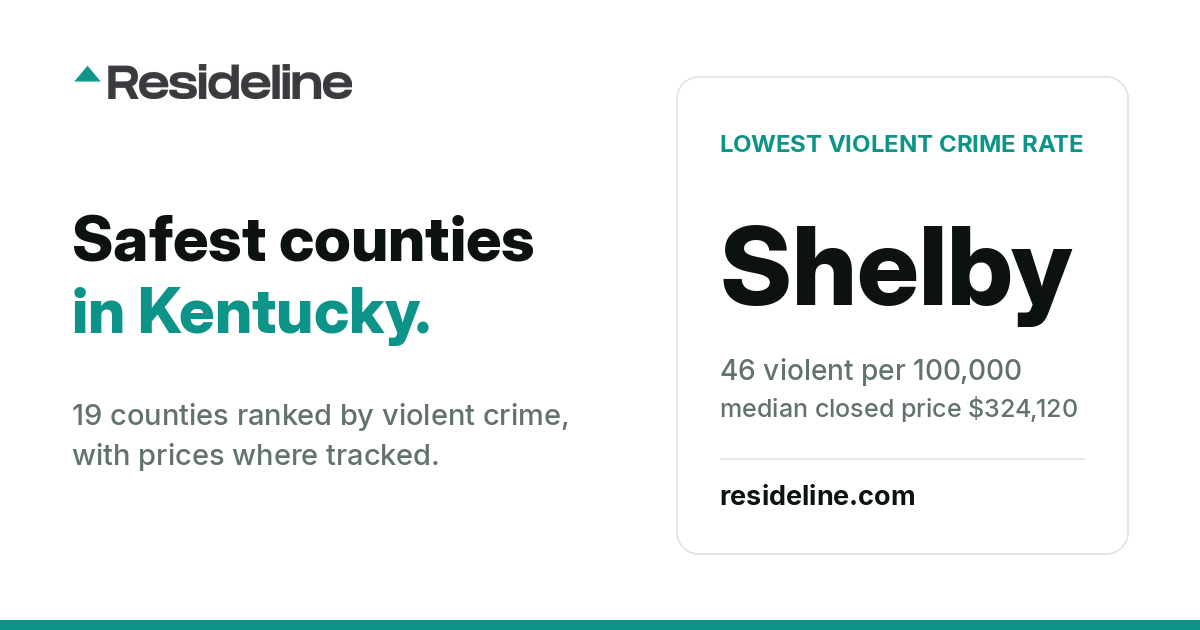
Safest Counties in Kentucky: 19 Ranked (2026)
The 19 Kentucky counties where police report enough to the FBI to build a reliable rate, ranked by violent crime, with home prices, asking rents and incomes where available.
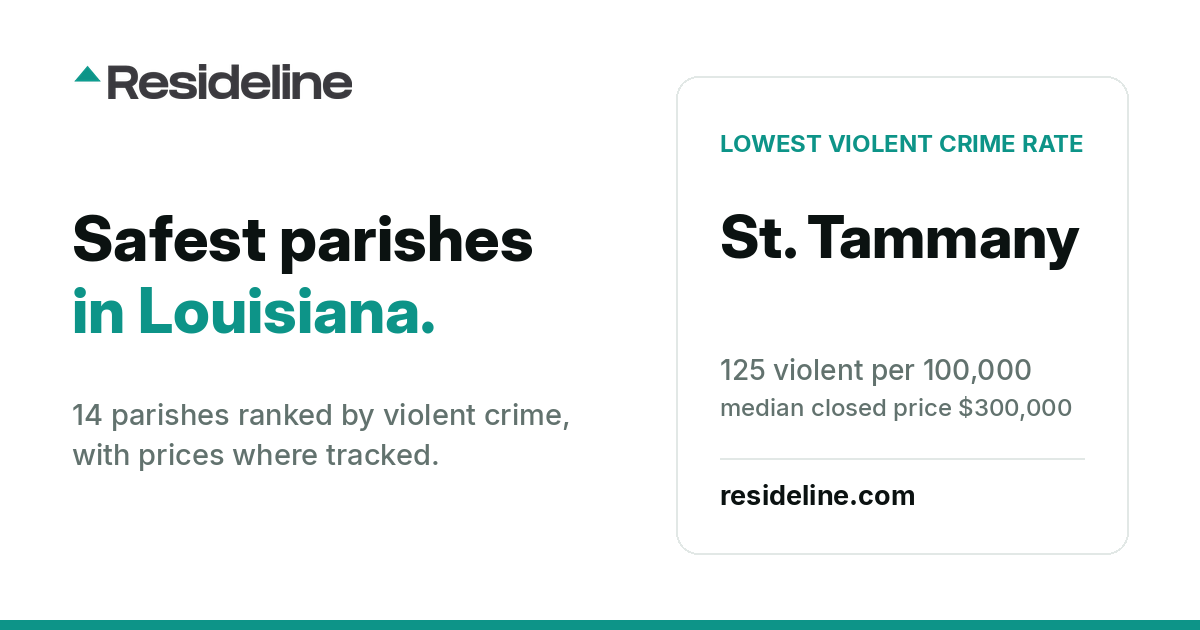
Safest Parishes in Louisiana: 14 Ranked (2026)
The 14 Louisiana parishes where police report enough to the FBI to build a reliable rate, ranked by violent crime, with home prices, asking rents and incomes where available.
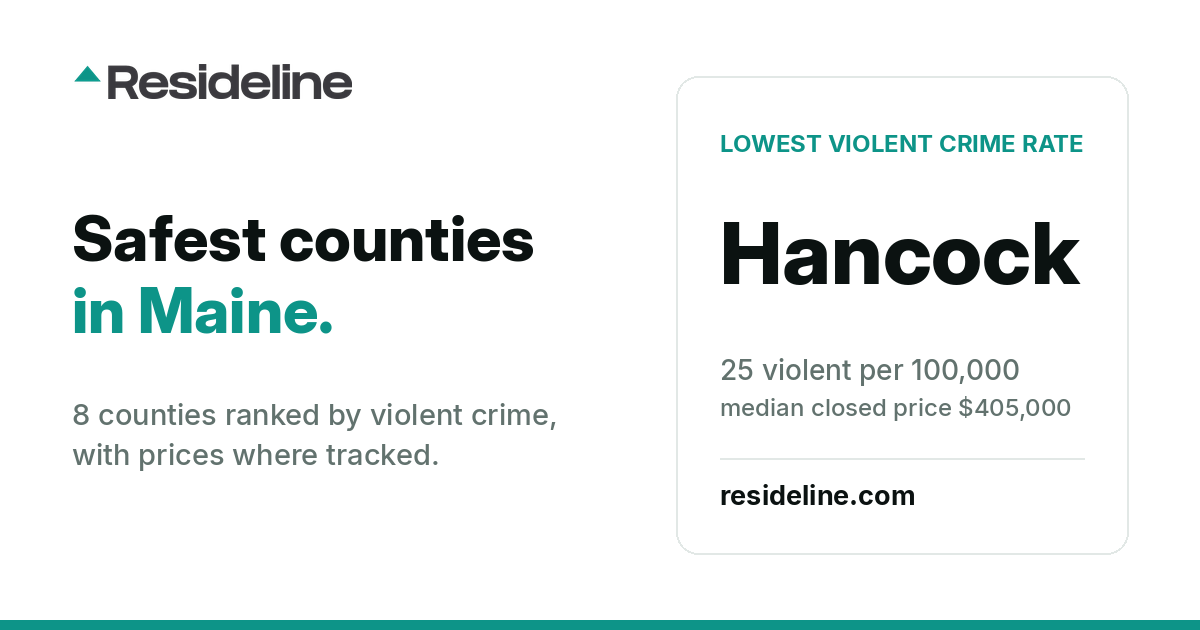
Safest Counties in Maine: 8 Ranked (2026)
The 8 Maine counties where police report enough to the FBI to build a reliable rate, ranked by violent crime, with home prices, asking rents and incomes where available.
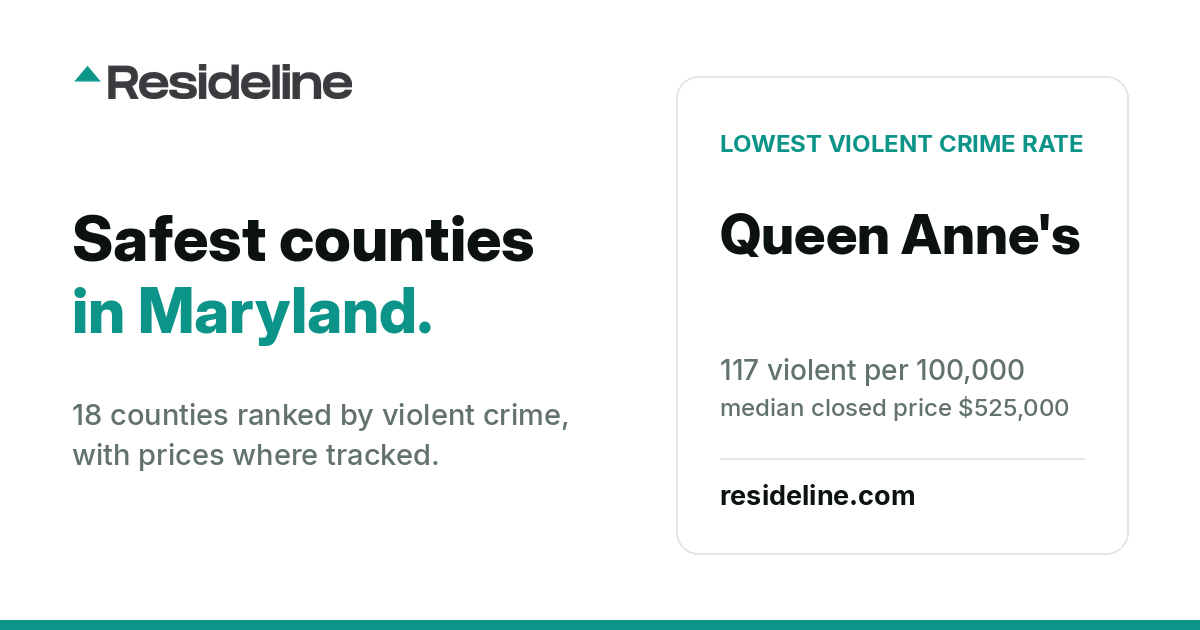
Safest Counties and Cities in Maryland: 18 Ranked (2026)
The 18 Maryland county equivalents where police report enough to the FBI to build a reliable rate, ranked by violent crime, with home prices, asking rents and incomes where available.
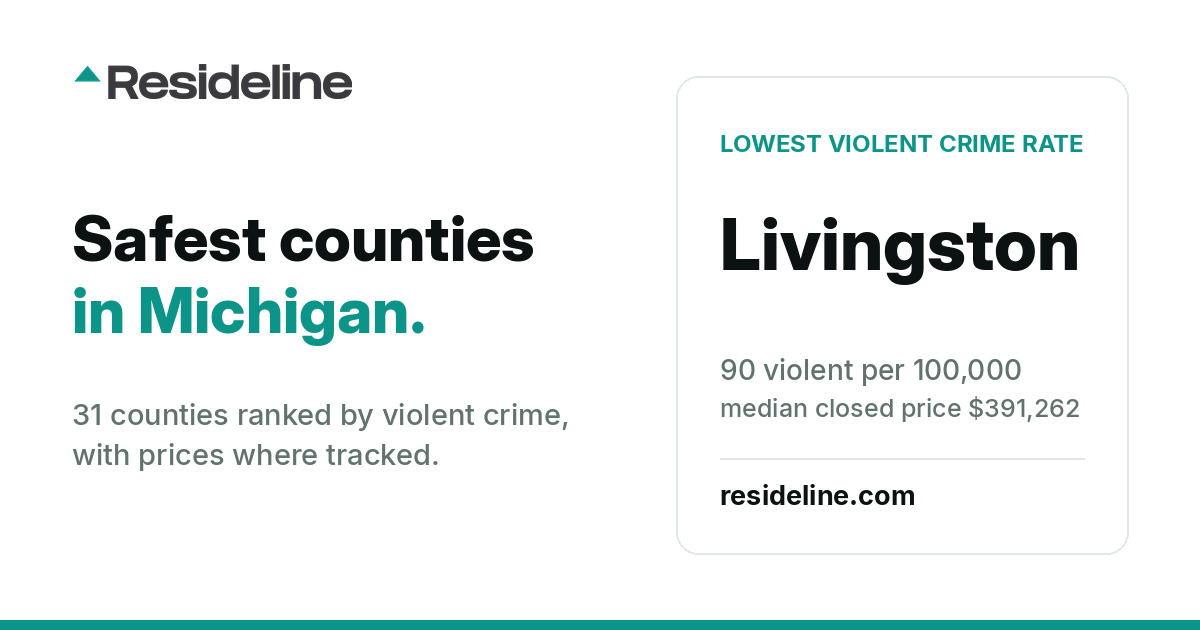
Safest Counties in Michigan: 31 Ranked (2026)
The 31 Michigan counties where police report enough to the FBI to build a reliable rate, ranked by violent crime, with home prices, asking rents and incomes where available.
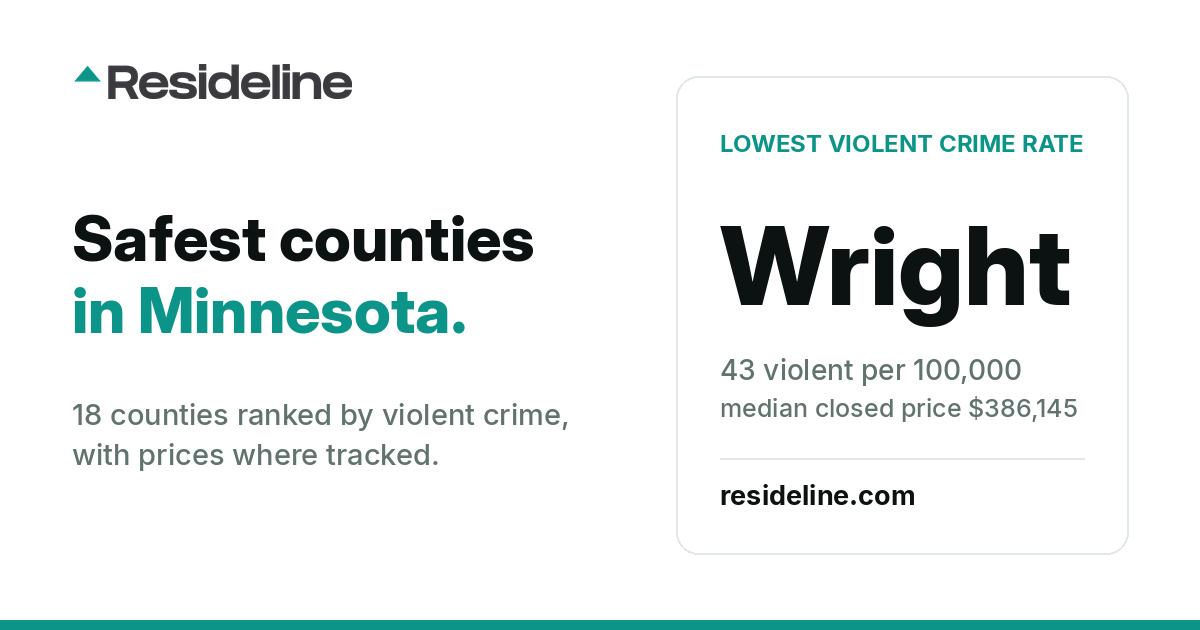
Safest Counties in Minnesota: 18 Ranked (2026)
The 18 Minnesota counties where police report enough to the FBI to build a reliable rate, ranked by violent crime, with home prices, asking rents and incomes where available.
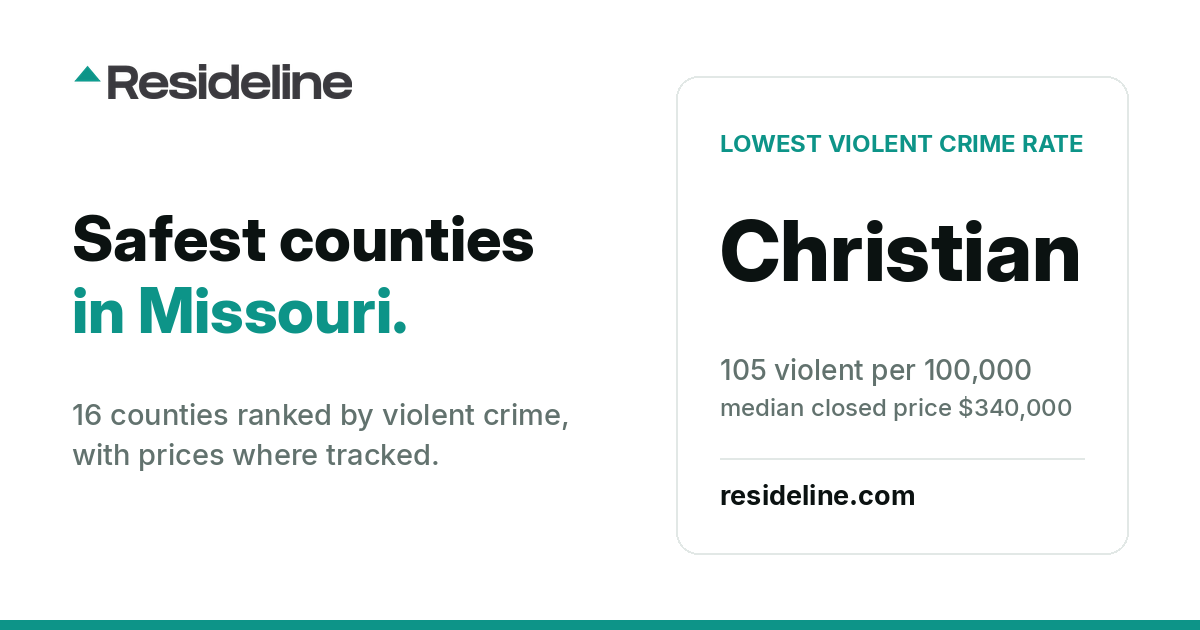
Safest Counties and Cities in Missouri: 16 Ranked (2026)
The 16 Missouri county equivalents where police report enough to the FBI to build a reliable rate, ranked by violent crime, with home prices, asking rents and incomes where available.
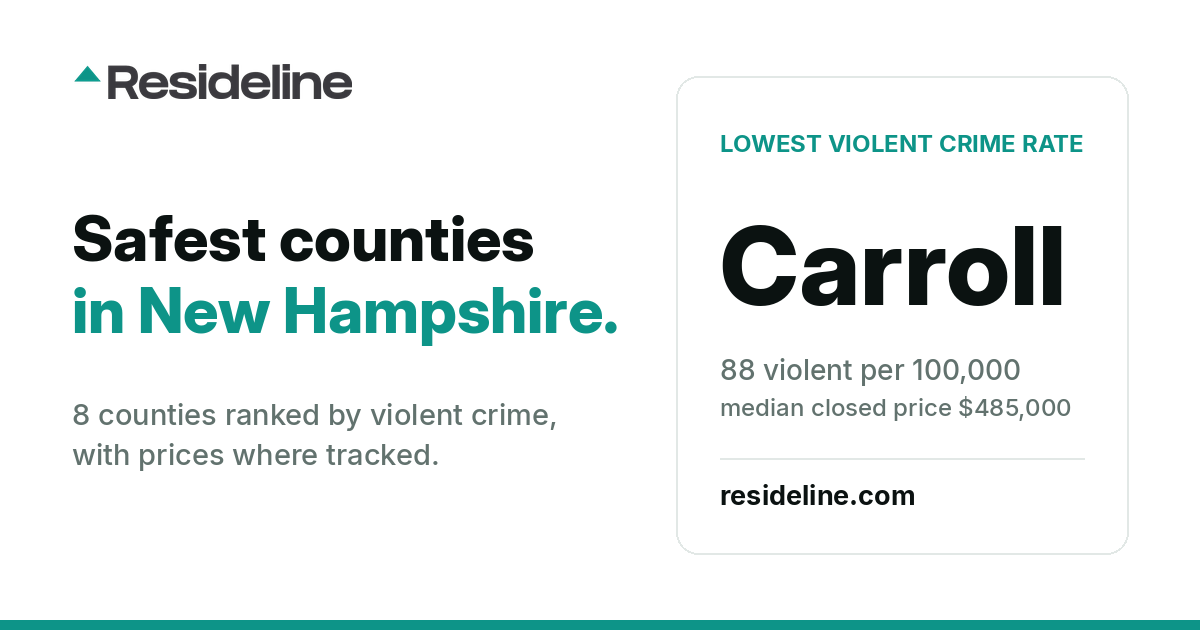
Safest Counties in New Hampshire: 8 Ranked (2026)
The 8 New Hampshire counties where police report enough to the FBI to build a reliable rate, ranked by violent crime, with home prices, asking rents and incomes where available.
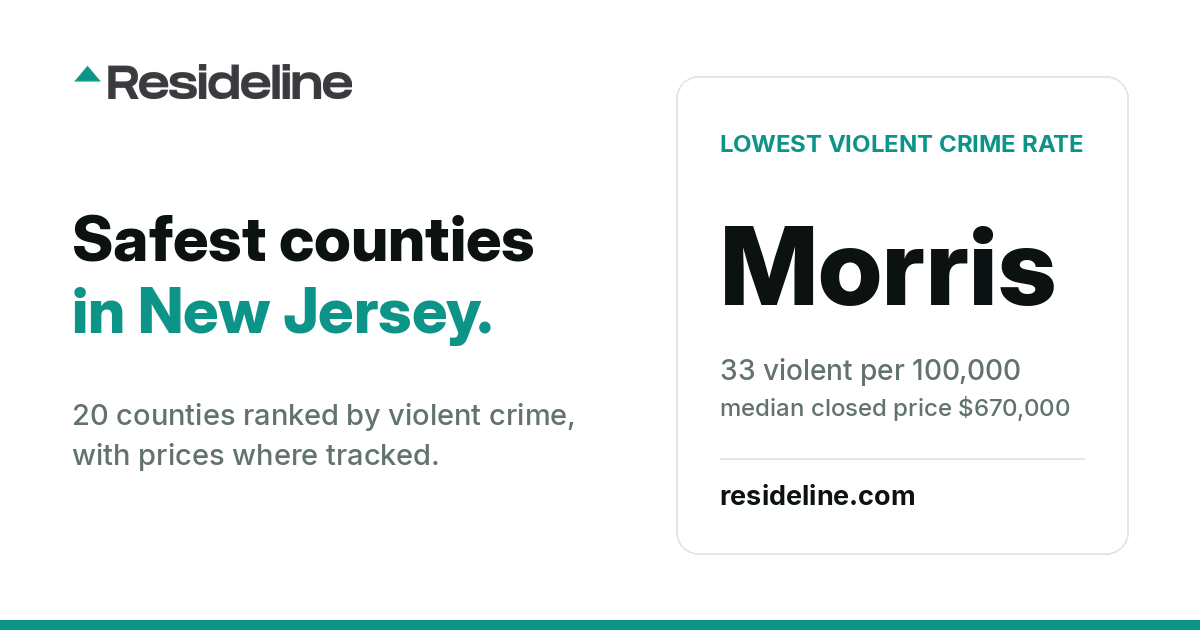
Safest Counties in New Jersey: 20 Ranked (2026)
The 20 New Jersey counties where police report enough to the FBI to build a reliable rate, ranked by violent crime, with home prices, asking rents and incomes where available.
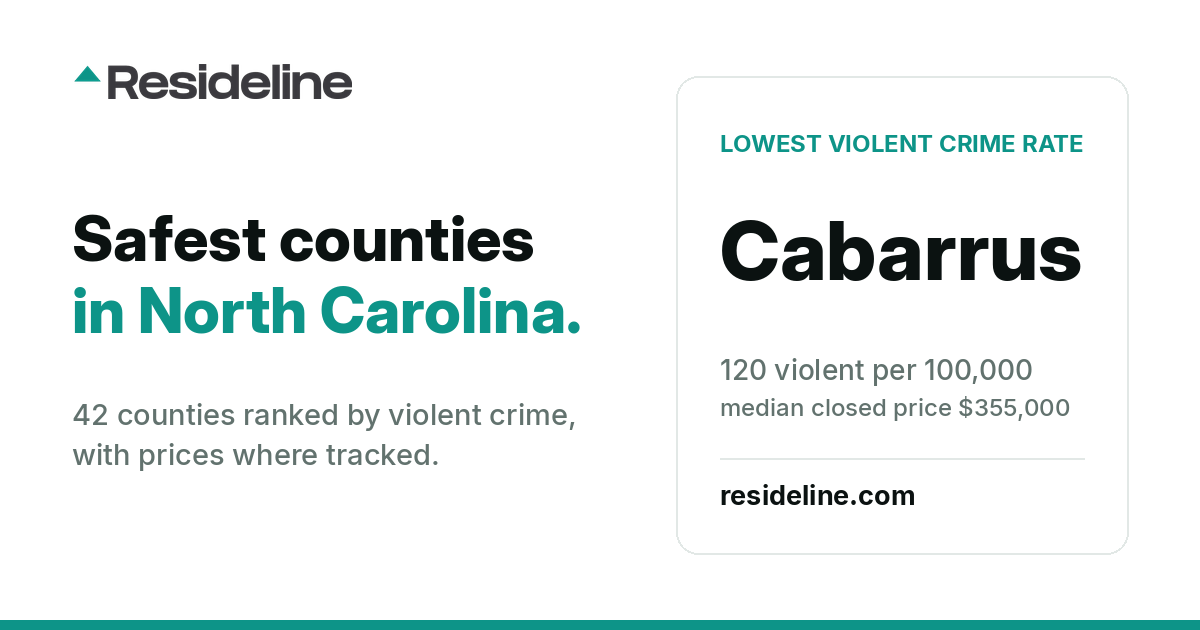
Safest Counties in North Carolina: 42 Ranked (2026)
The 42 North Carolina counties where police report enough to the FBI to build a reliable rate, ranked by violent crime, with home prices, asking rents and incomes where available.
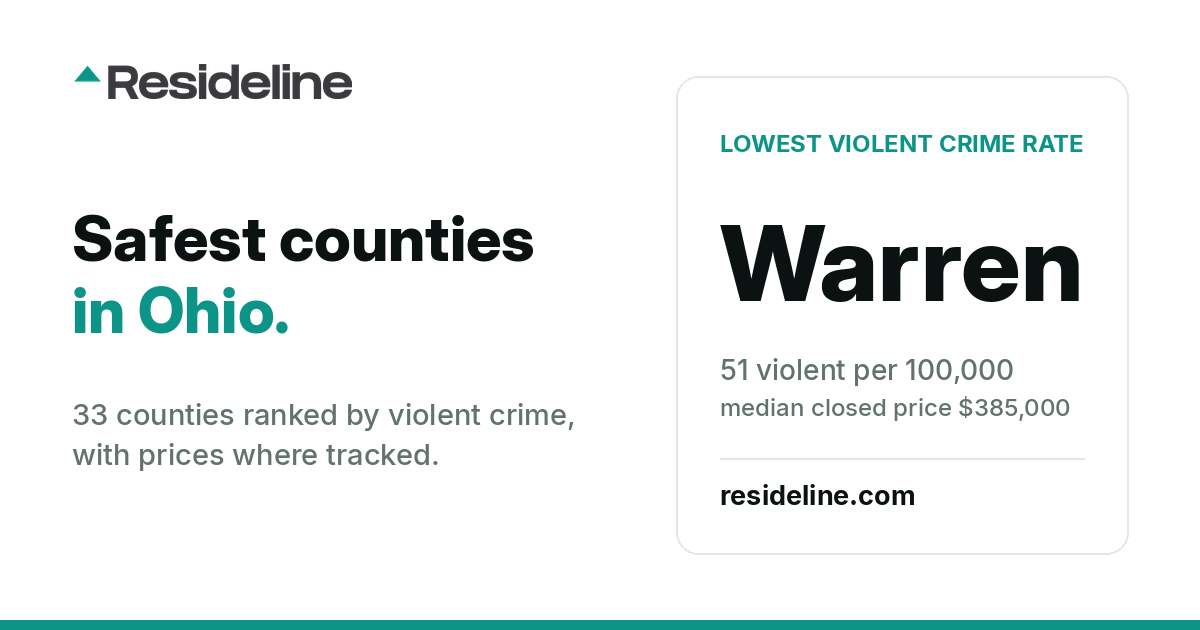
Safest Counties in Ohio: 33 Ranked (2026)
The 33 Ohio counties where police report enough to the FBI to build a reliable rate, ranked by violent crime, with home prices, asking rents and incomes where available.
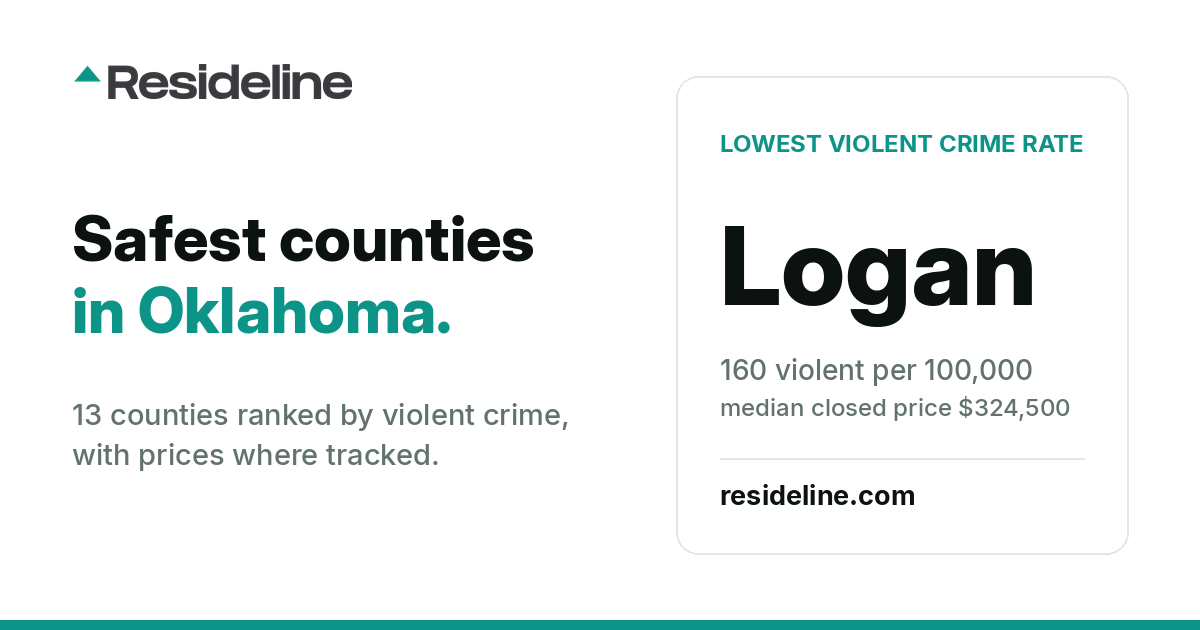
Safest Counties in Oklahoma: 13 Ranked (2026)
The 13 Oklahoma counties where police report enough to the FBI to build a reliable rate, ranked by violent crime, with home prices, asking rents and incomes where available.
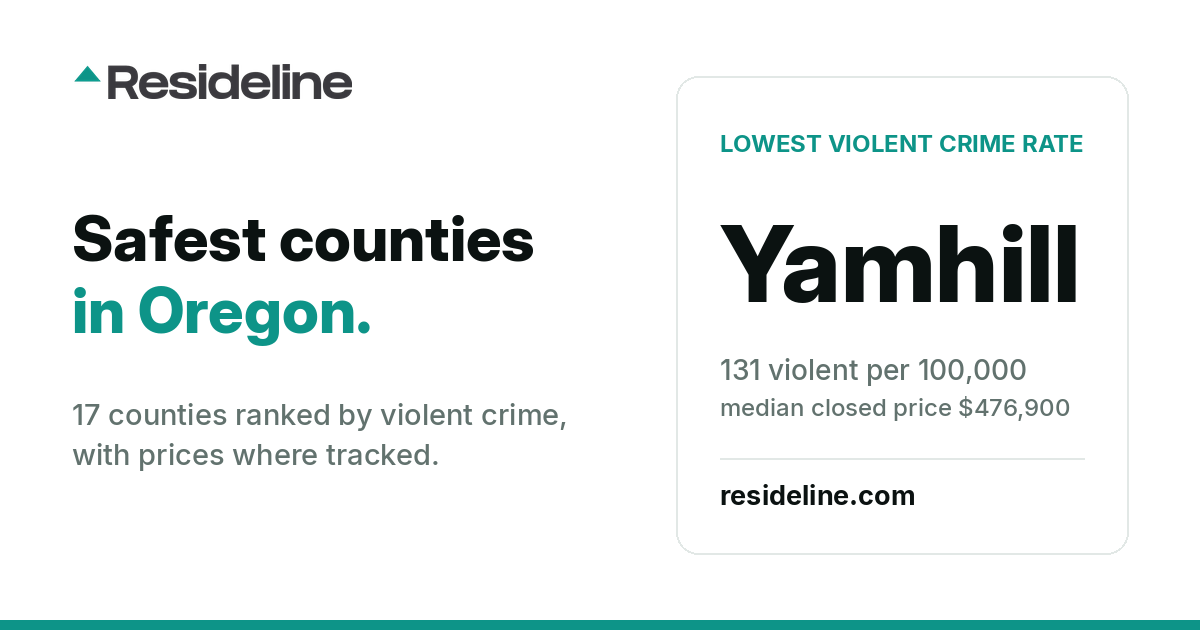
Safest Counties in Oregon: 17 Ranked (2026)
The 17 Oregon counties where police report enough to the FBI to build a reliable rate, ranked by violent crime, with home prices, asking rents and incomes where available.
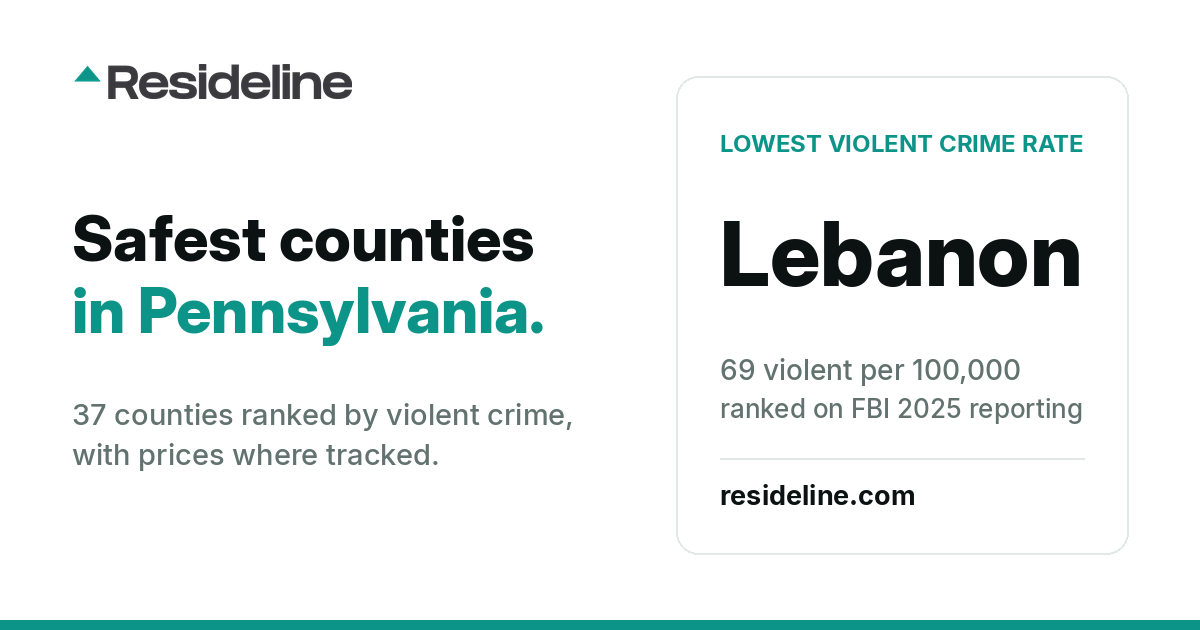
Safest Counties in Pennsylvania: 37 Ranked (2026)
The 37 Pennsylvania counties where police report enough to the FBI to build a reliable rate, ranked by violent crime, with home prices, asking rents and incomes where available.
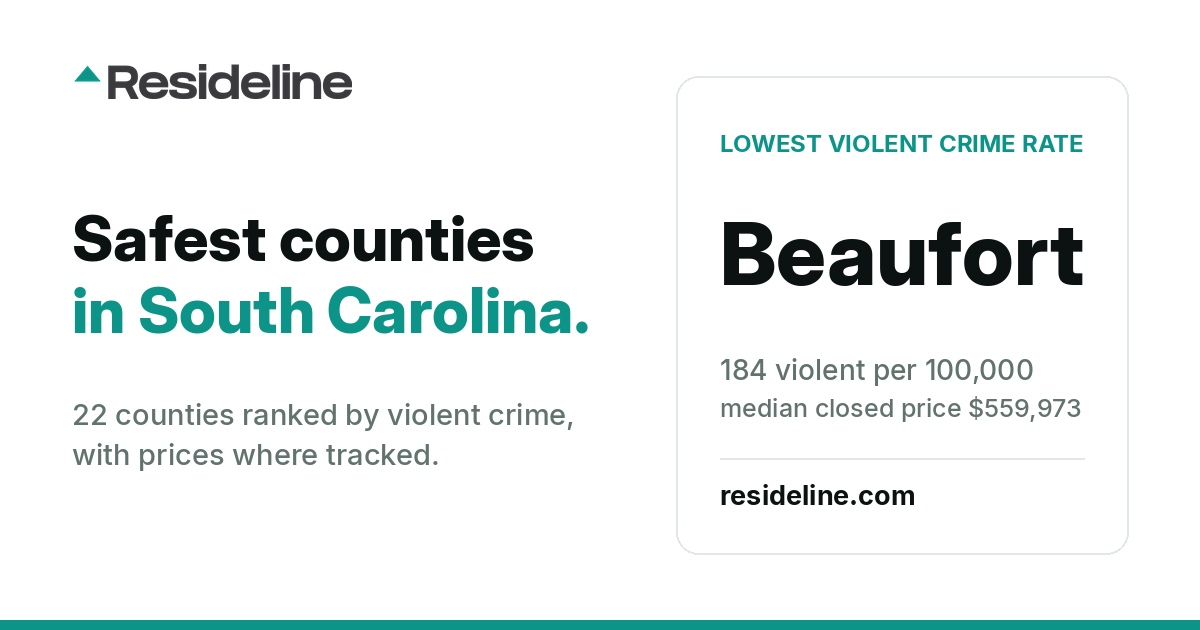
Safest Counties in South Carolina: 22 Ranked (2026)
The 22 South Carolina counties where police report enough to the FBI to build a reliable rate, ranked by violent crime, with home prices, asking rents and incomes where available.
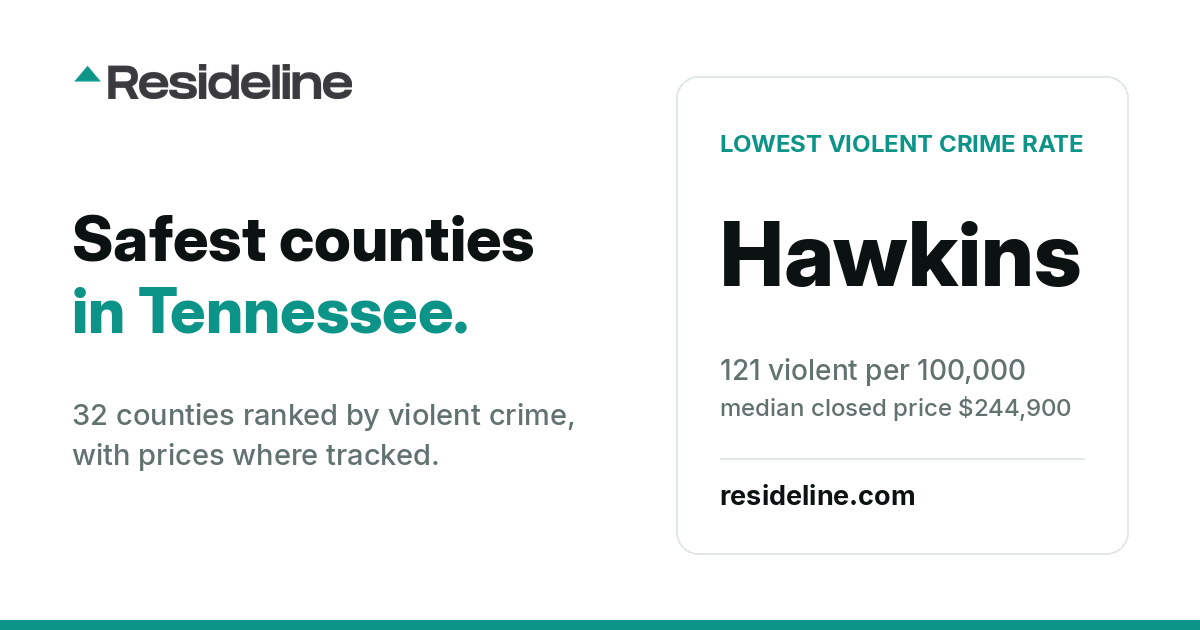
Safest Counties in Tennessee: 32 Ranked (2026)
The 32 Tennessee counties where police report enough to the FBI to build a reliable rate, ranked by violent crime, with home prices, asking rents and incomes where available.
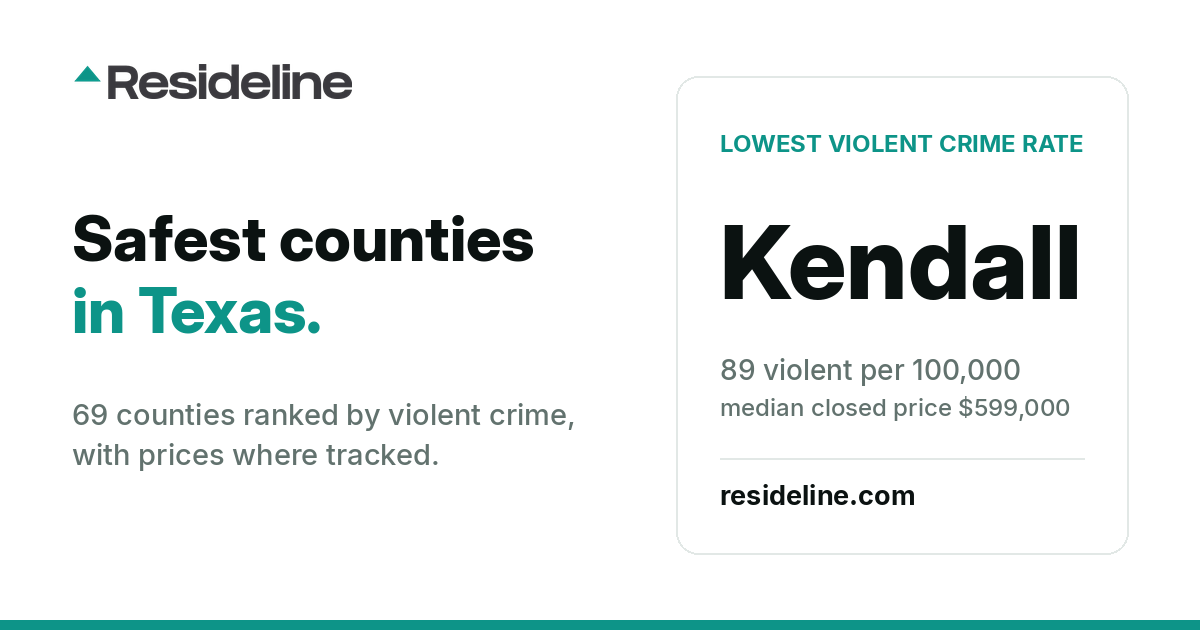
Safest Counties in Texas: 69 Ranked (2026)
The 69 Texas counties where police report enough to the FBI to build a reliable rate, ranked by violent crime, with home prices, asking rents and incomes where available.
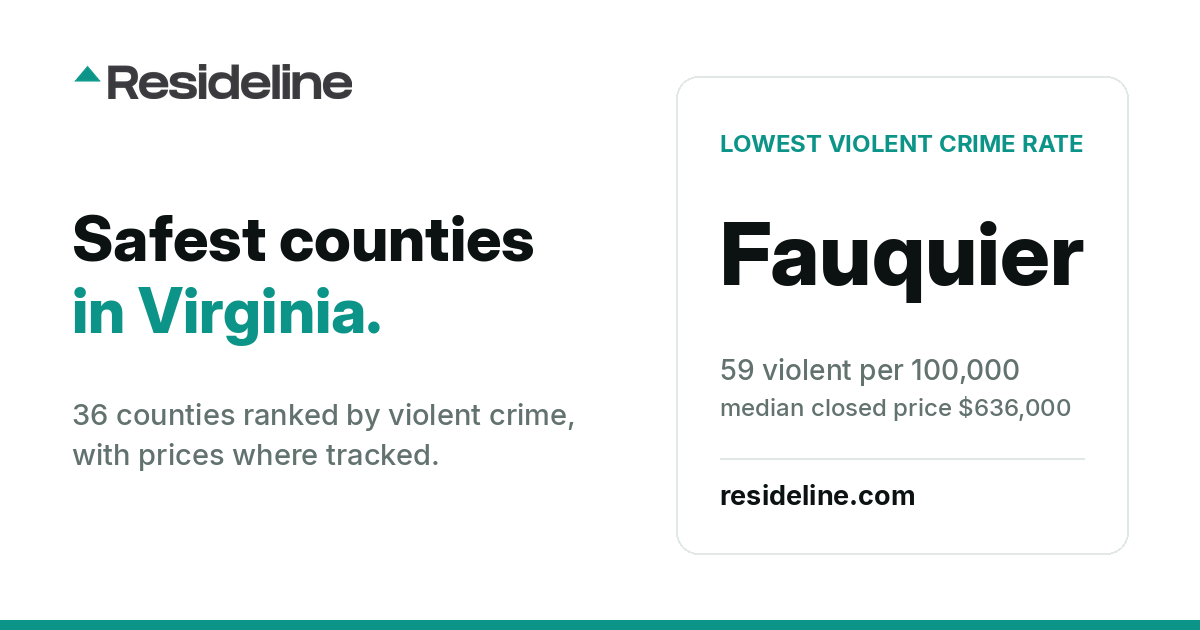
Safest Counties and Cities in Virginia: 36 Ranked (2026)
The 36 Virginia county equivalents where police report enough to the FBI to build a reliable rate, ranked by violent crime, with home prices, asking rents and incomes where available.
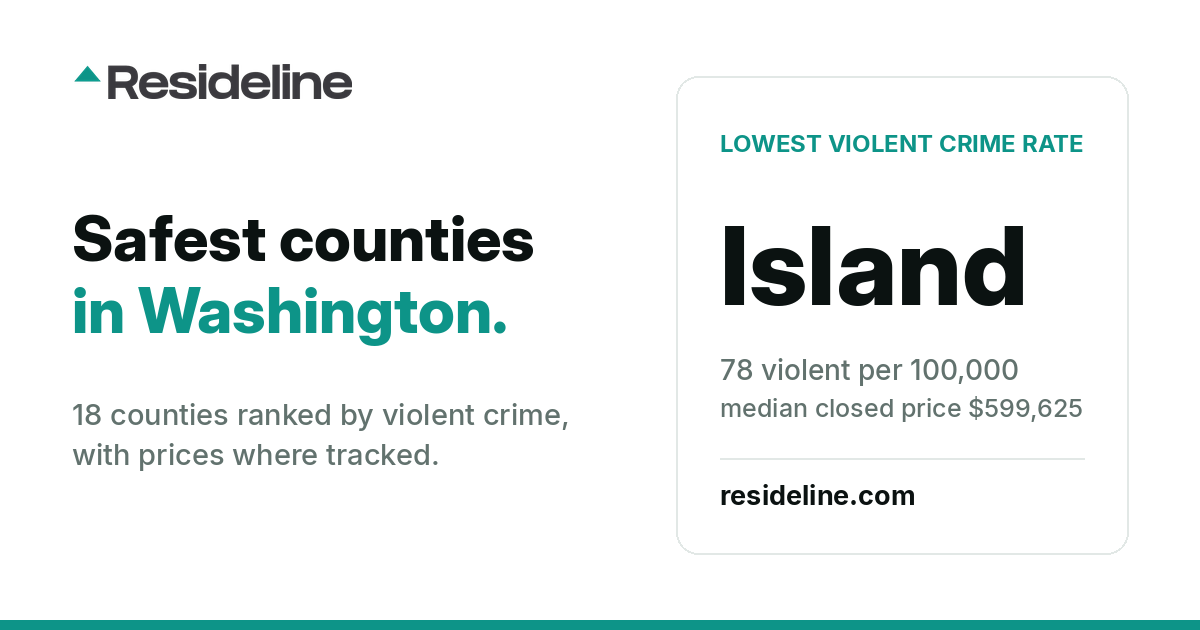
Safest Counties in Washington: 18 Ranked (2026)
The 18 Washington counties where police report enough to the FBI to build a reliable rate, ranked by violent crime, with home prices, asking rents and incomes where available.
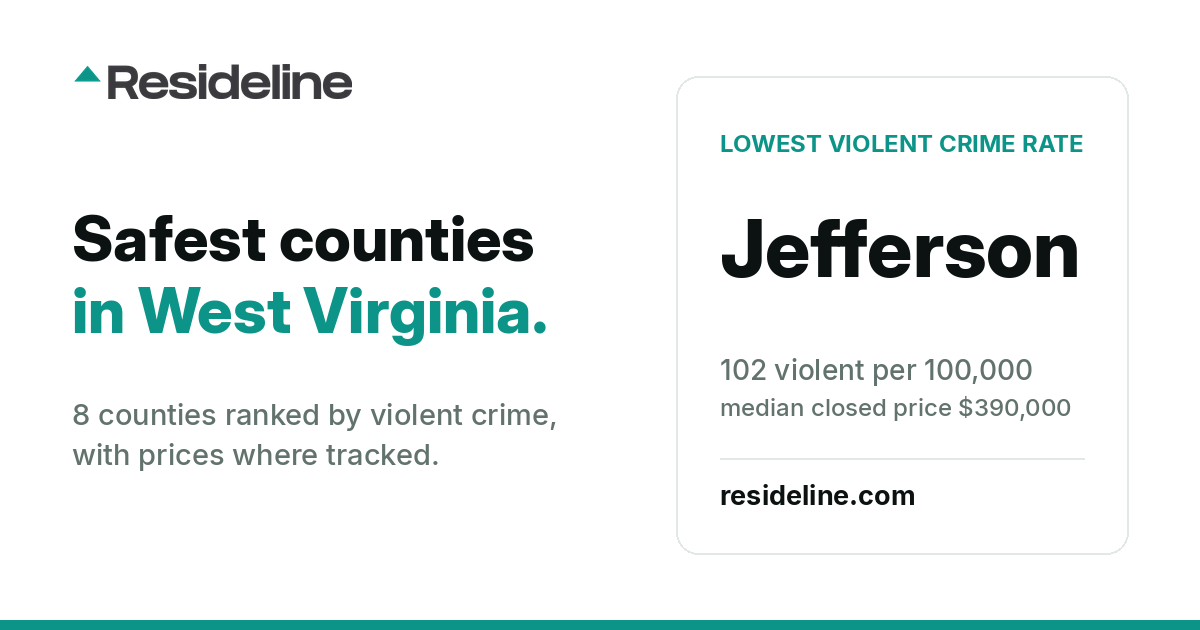
Safest Counties in West Virginia: 8 Ranked (2026)
The 8 West Virginia counties where police report enough to the FBI to build a reliable rate, ranked by violent crime, with home prices, asking rents and incomes where available.
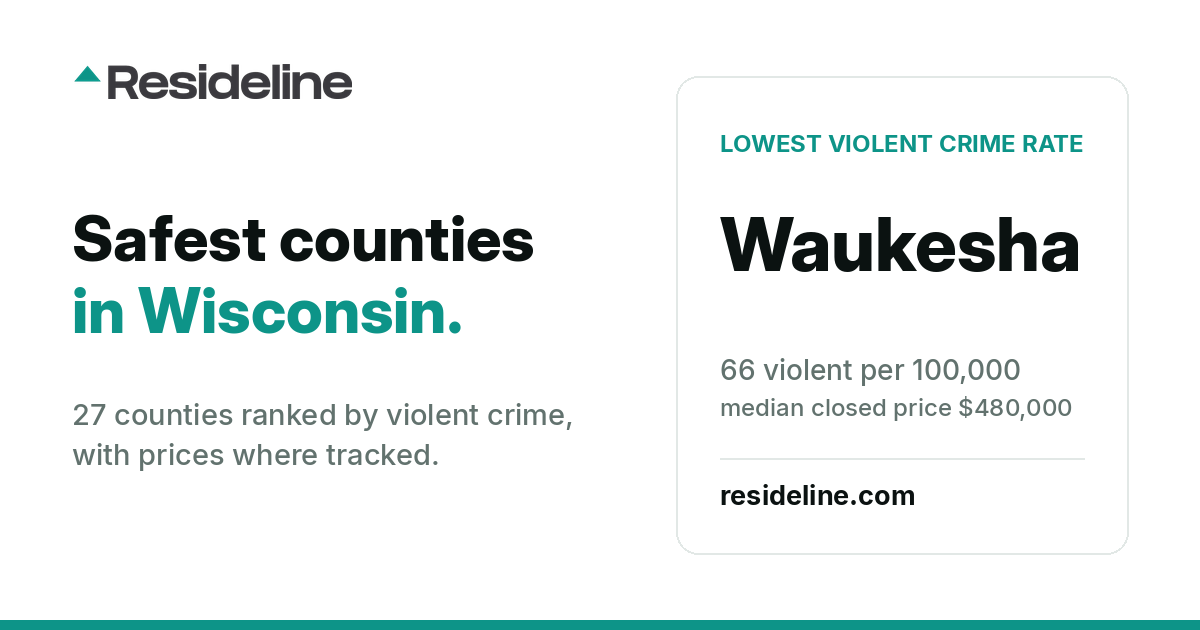
Safest Counties in Wisconsin: 27 Ranked (2026)
The 27 Wisconsin counties where police report enough to the FBI to build a reliable rate, ranked by violent crime, with home prices, asking rents and incomes where available.
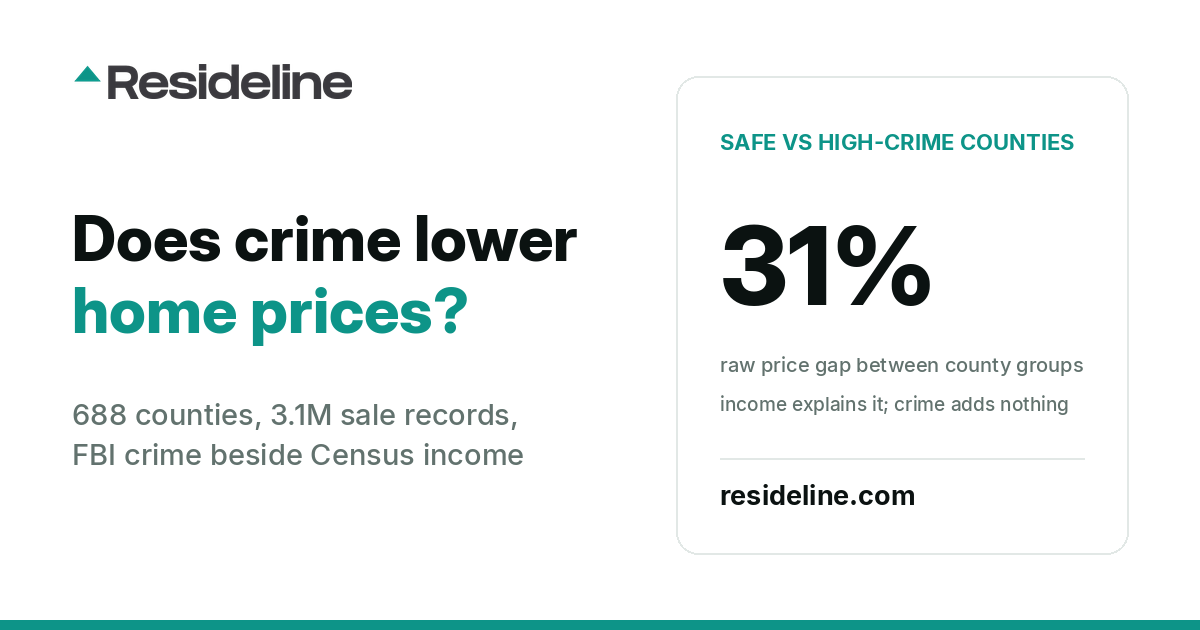
Does Crime Actually Lower Home Prices? We Checked 688 Counties
The safest quarter of US counties has a median closed price 31 percent higher than the highest-crime quarter, and earns 33 percent more. Hold income and density constant and a county's crime rate adds nothing measurable. 688 counties, 3.1 million sale records.
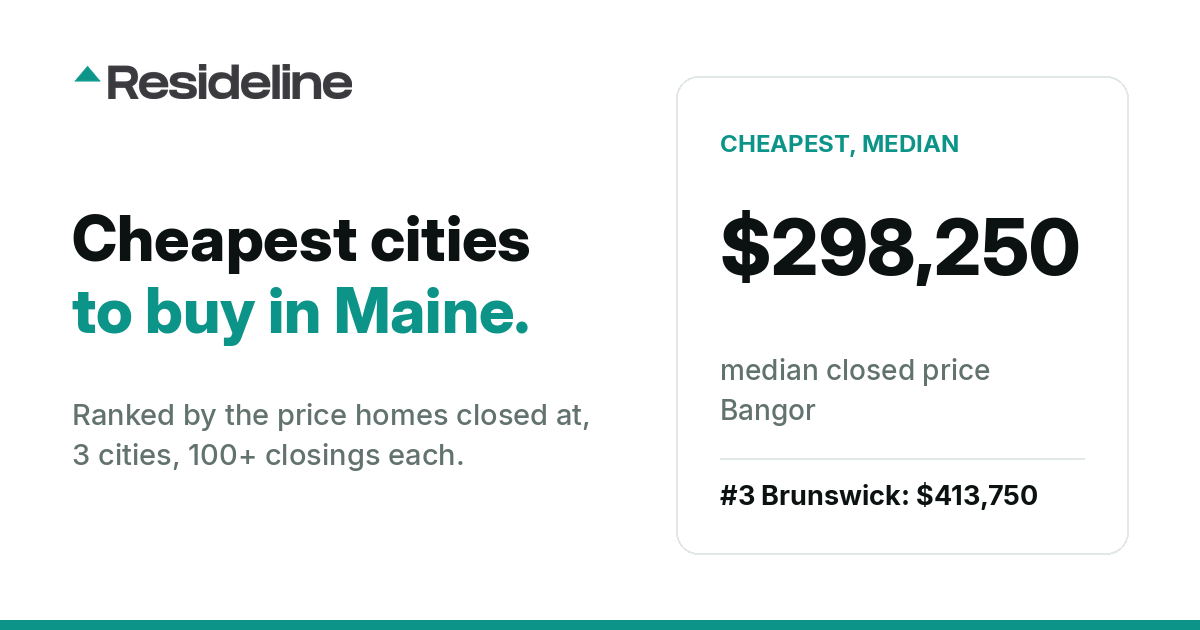
Cheapest Cities to Buy a House in Maine (2026)
The 3 cheapest Maine cities by median closed price, from $298,250 in Bangor to $413,750 in Brunswick, with what houses cost per square foot, what resales did, and how fast listings go.

Cap Rate by City: Gross Rental Yields for 597 US Cities (2026)
Gross rental yield, the number every cap rate starts from, ranked for 597 US cities from Resideline's closings and rental listings. Median city 6.57 percent; 94 cities at 8 percent or more.
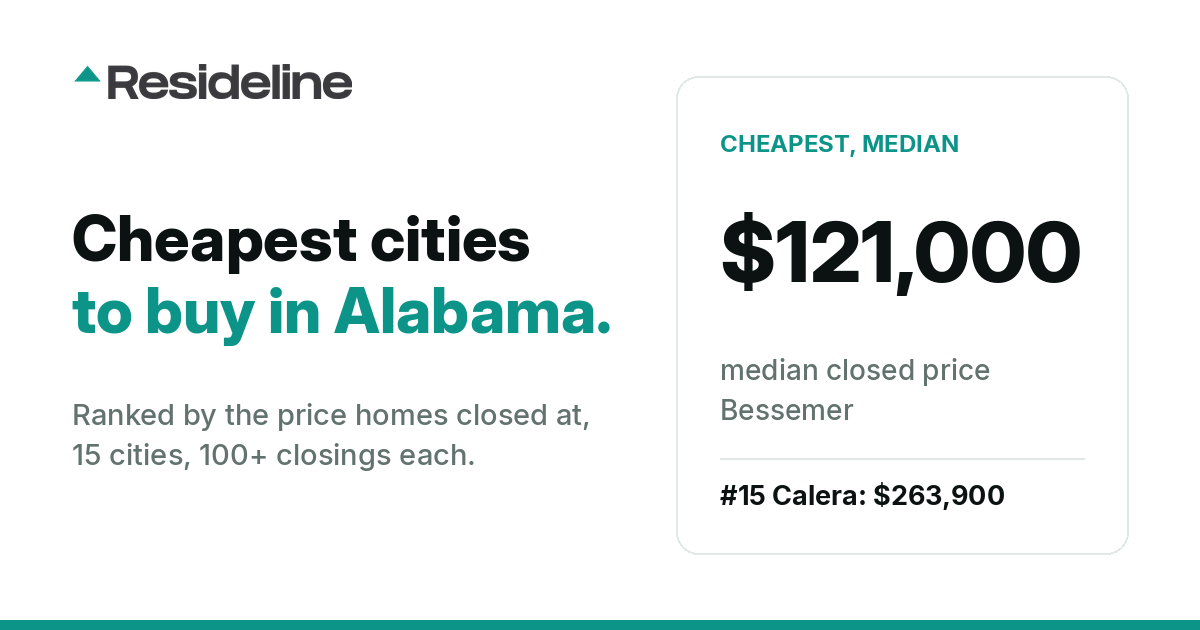
Cheapest Cities to Buy a House in Alabama (2026)
The 15 cheapest Alabama cities by median closed price, from $121,000 in Bessemer to $263,900 in Calera, with what houses cost per square foot, what resales did, and how fast listings go.
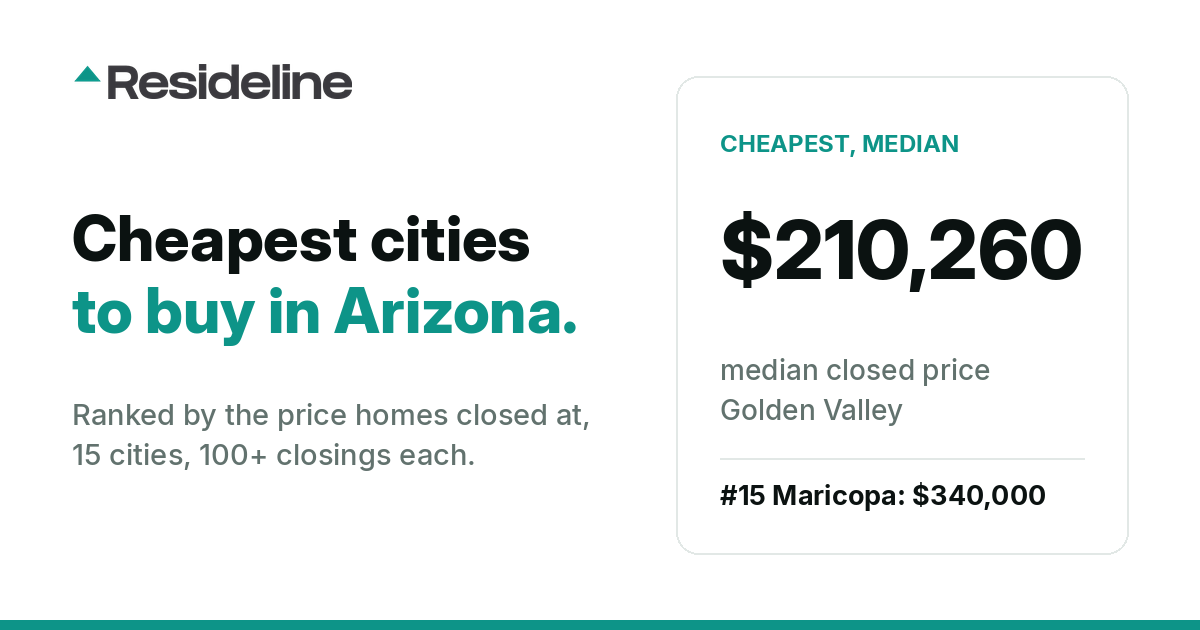
Cheapest Cities to Buy a House in Arizona (2026)
The 15 cheapest Arizona cities by median closed price, from $210,260 in Golden Valley to $340,000 in Maricopa, with what houses cost per square foot, what resales did, and how fast listings go.
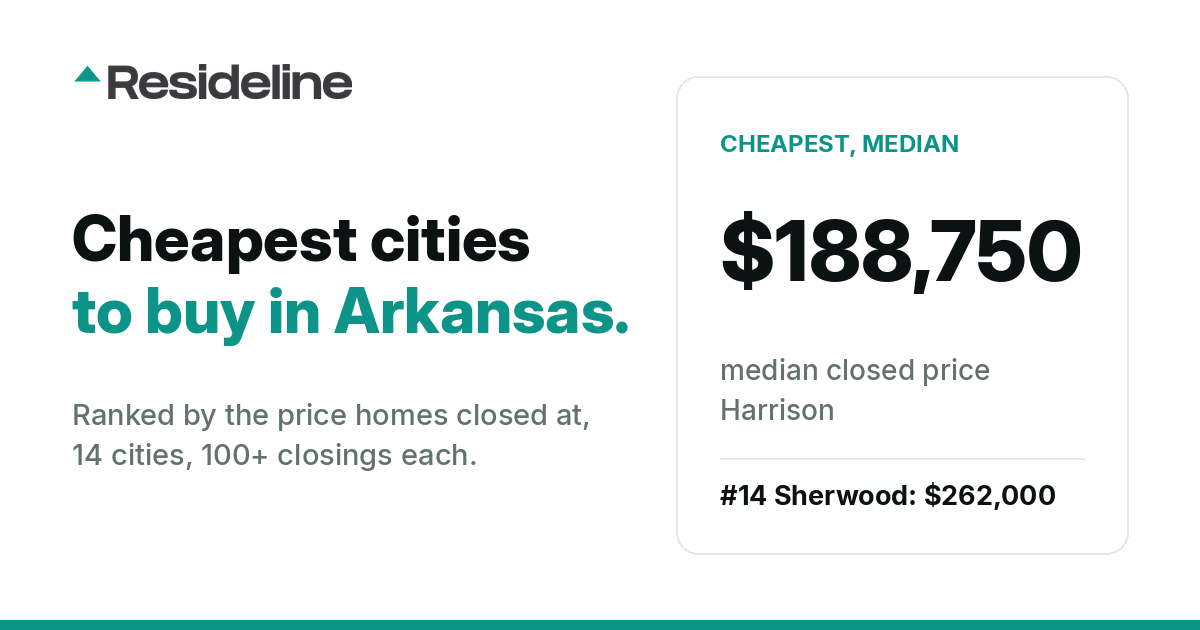
Cheapest Cities to Buy a House in Arkansas (2026)
The 14 cheapest Arkansas cities by median closed price, from $188,750 in Harrison to $262,000 in Sherwood, with what houses cost per square foot, what resales did, and how fast listings go.
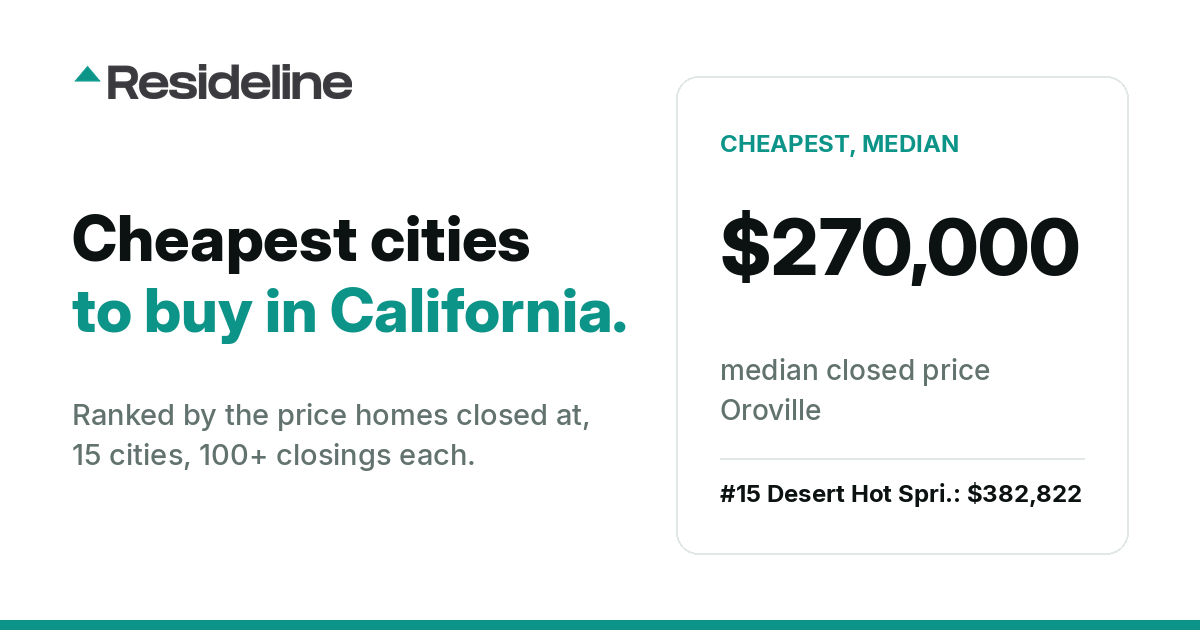
Cheapest Cities to Buy a House in California (2026)
The 15 cheapest California cities by median closed price, from $270,000 in Oroville to $382,822 in Desert Hot Springs, with what houses cost per square foot, what resales did, and how fast listings go.
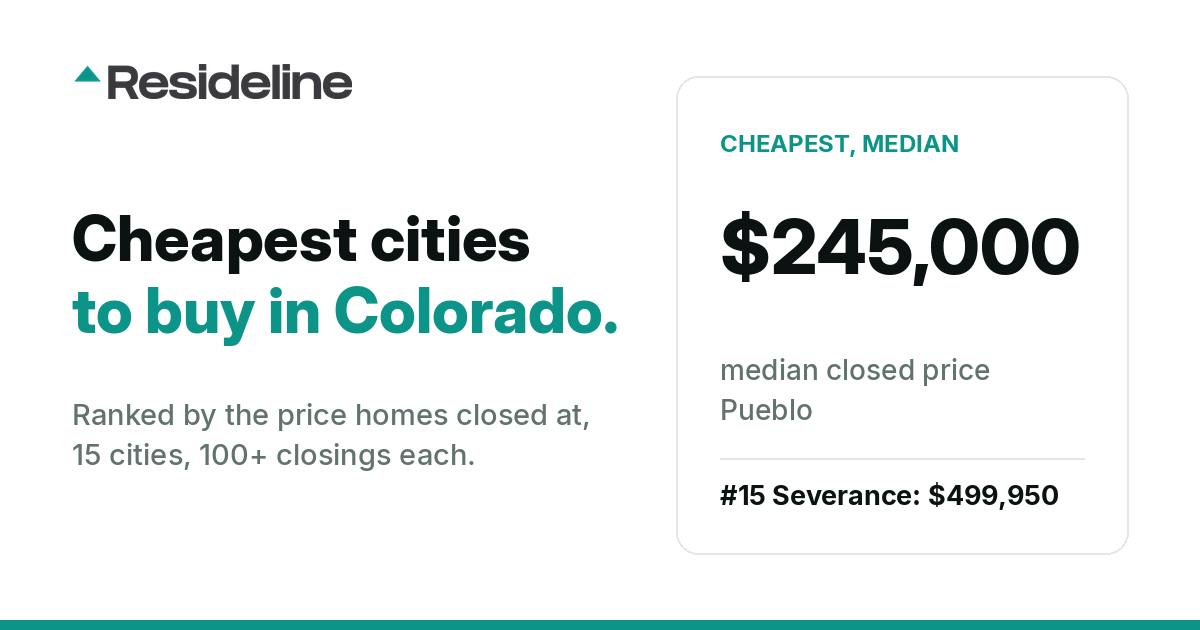
Cheapest Cities to Buy a House in Colorado (2026)
The 15 cheapest Colorado cities by median closed price, from $245,000 in Pueblo to $499,950 in Severance, with what houses cost per square foot, what resales did, and how fast listings go.
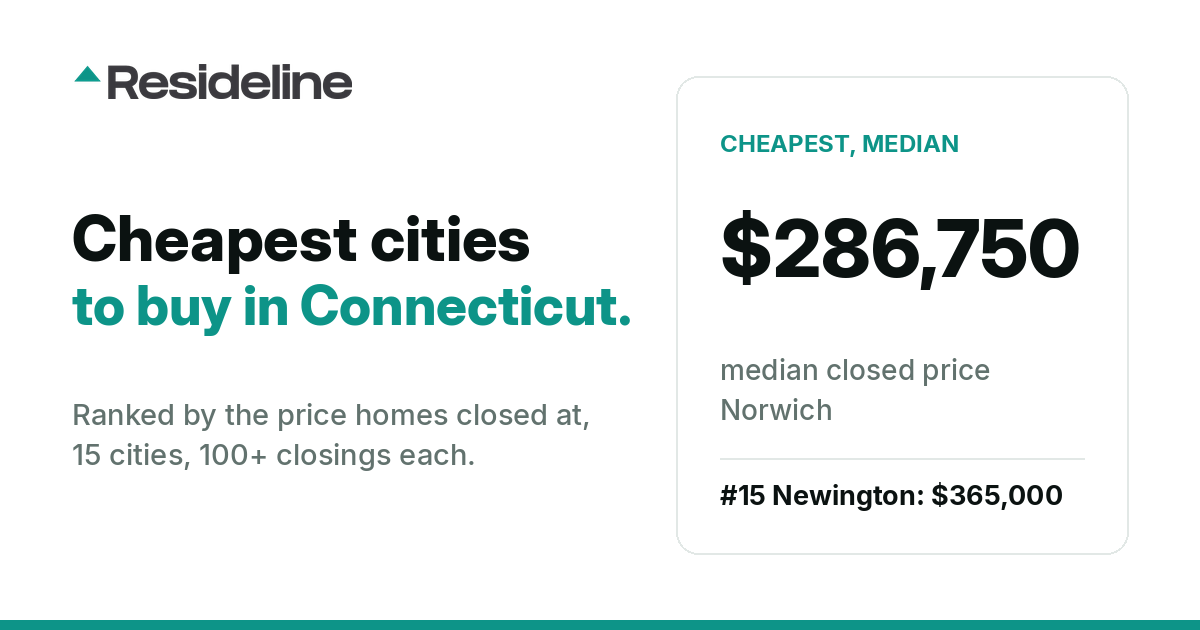
Cheapest Cities to Buy a House in Connecticut (2026)
The 15 cheapest Connecticut cities by median closed price, from $286,750 in Norwich to $365,000 in Newington, with what houses cost per square foot, what resales did, and how fast listings go.
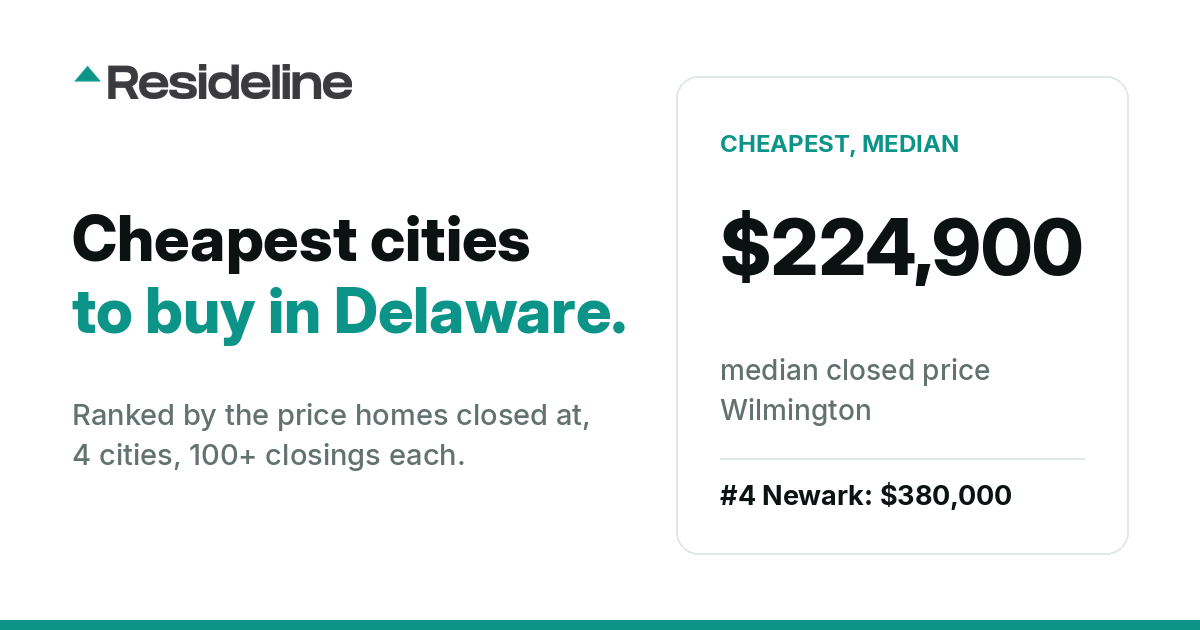
Cheapest Cities to Buy a House in Delaware (2026)
The 4 cheapest Delaware cities by median closed price, from $224,900 in Wilmington to $380,000 in Newark, with what houses cost per square foot, what resales did, and how fast listings go.
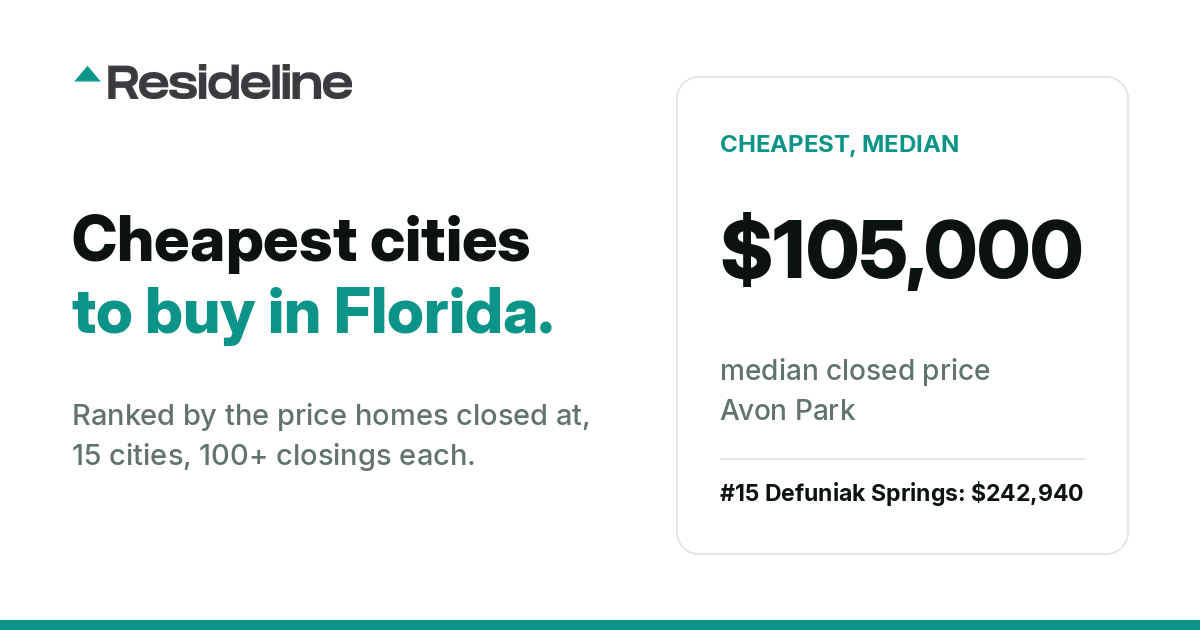
Cheapest Cities to Buy a House in Florida (2026)
The 15 cheapest Florida cities by median closed price, from $105,000 in Avon Park to $242,940 in Defuniak Springs, with what houses cost per square foot, what resales did, and how fast listings go.
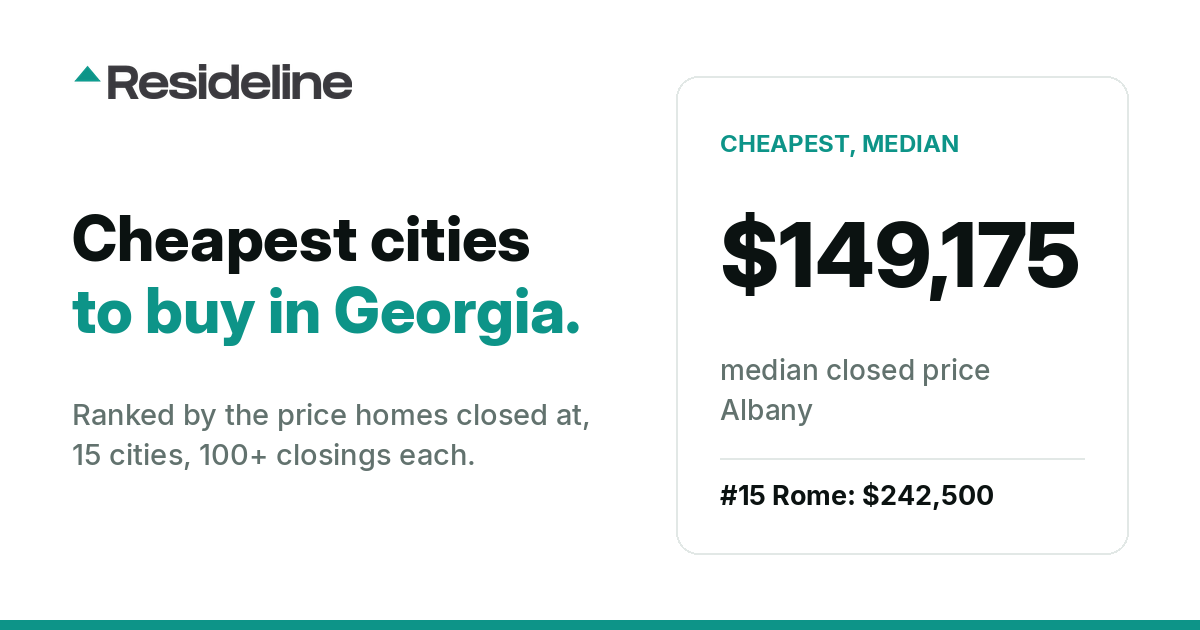
Cheapest Cities to Buy a House in Georgia (2026)
The 15 cheapest Georgia cities by median closed price, from $149,175 in Albany to $242,500 in Rome, with what houses cost per square foot, what resales did, and how fast listings go.
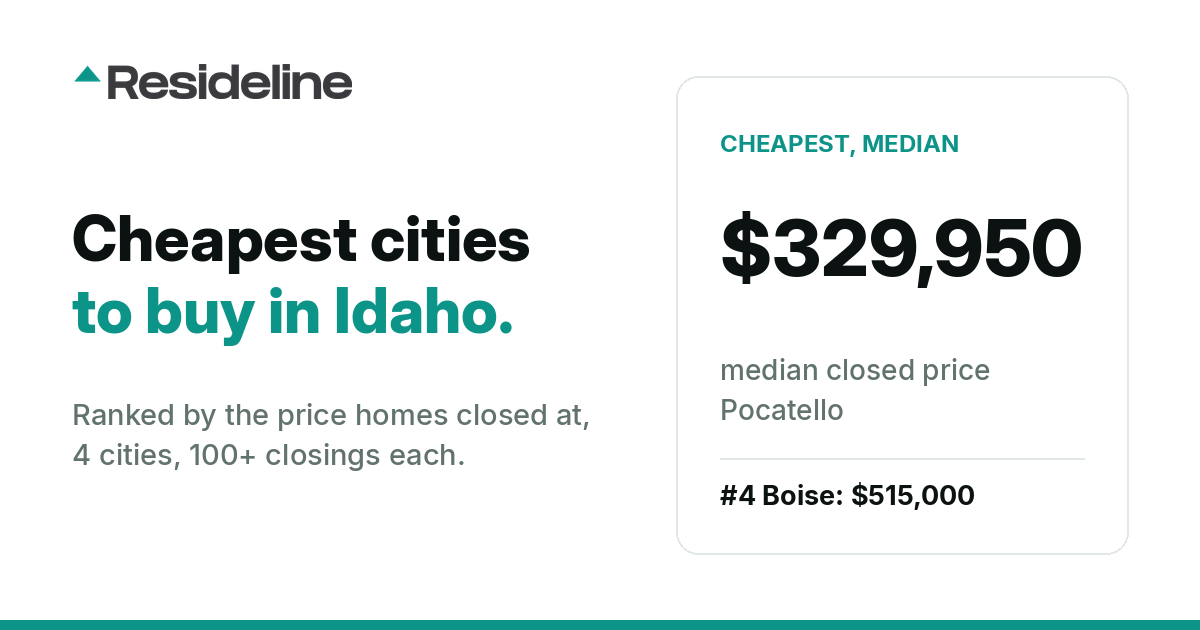
Cheapest Cities to Buy a House in Idaho (2026)
The 4 cheapest Idaho cities by median closed price, from $329,950 in Pocatello to $515,000 in Boise, with what houses cost per square foot, what resales did, and how fast listings go.
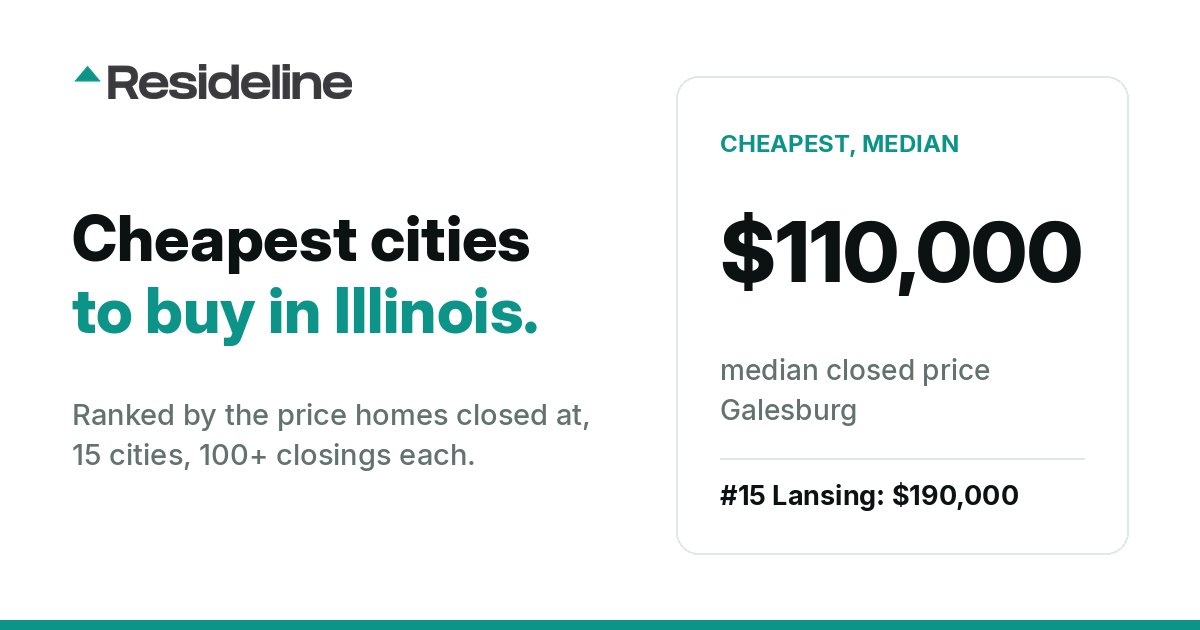
Cheapest Cities to Buy a House in Illinois (2026)
The 15 cheapest Illinois cities by median closed price, from $110,000 in Galesburg to $190,000 in Lansing, with what houses cost per square foot, what resales did, and how fast listings go.
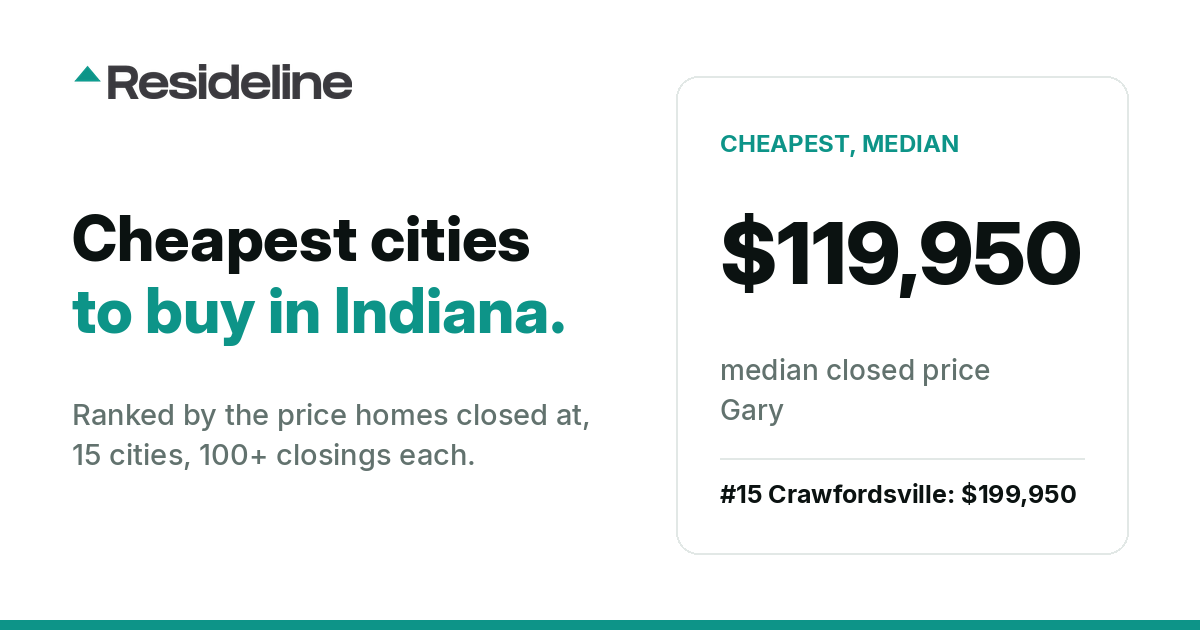
Cheapest Cities to Buy a House in Indiana (2026)
The 15 cheapest Indiana cities by median closed price, from $119,950 in Gary to $199,950 in Crawfordsville, with what houses cost per square foot, what resales did, and how fast listings go.
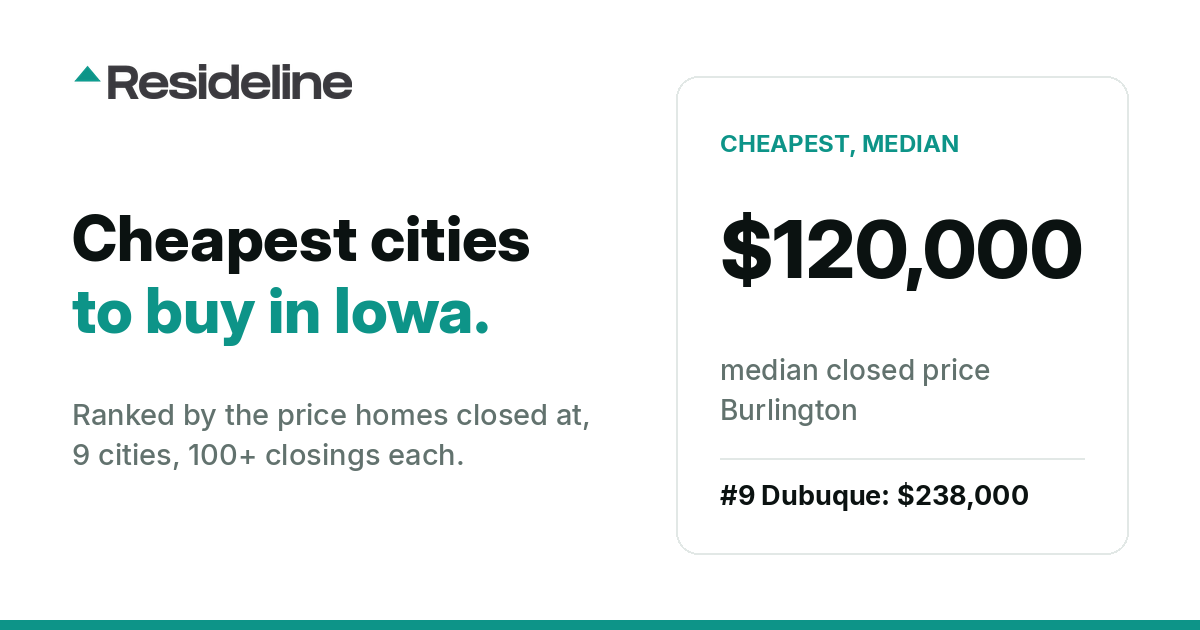
Cheapest Cities to Buy a House in Iowa (2026)
The 9 cheapest Iowa cities by median closed price, from $120,000 in Burlington to $238,000 in Dubuque, with what houses cost per square foot, what resales did, and how fast listings go.
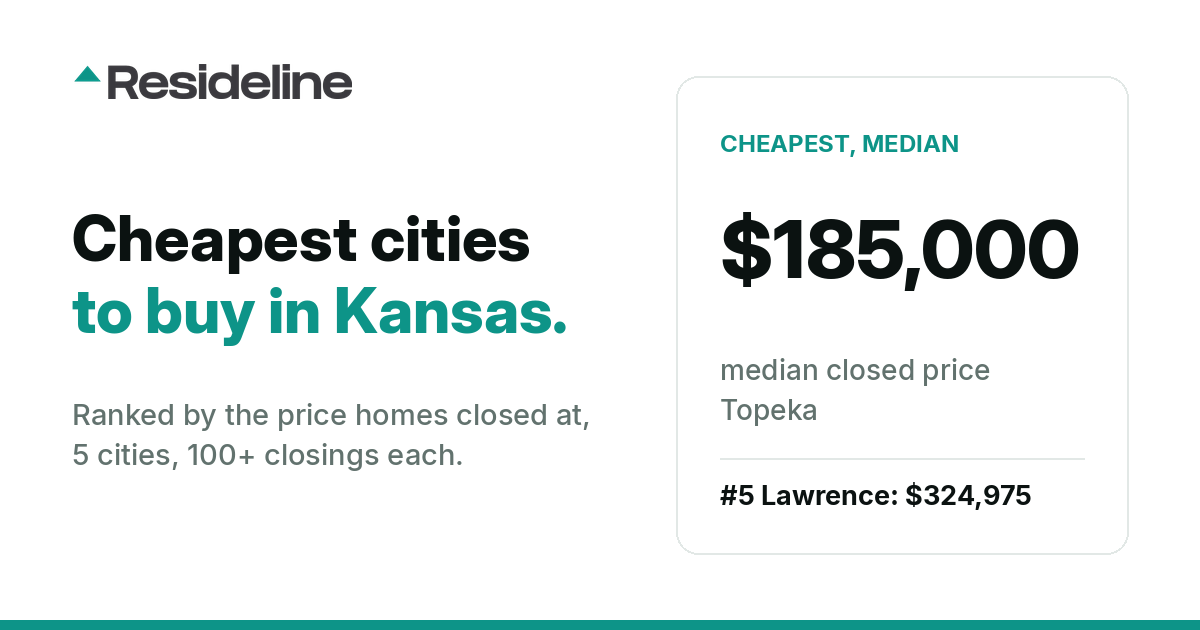
Cheapest Cities to Buy a House in Kansas (2026)
The 5 cheapest Kansas cities by median closed price, from $185,000 in Topeka to $324,975 in Lawrence, with what houses cost per square foot, what resales did, and how fast listings go.
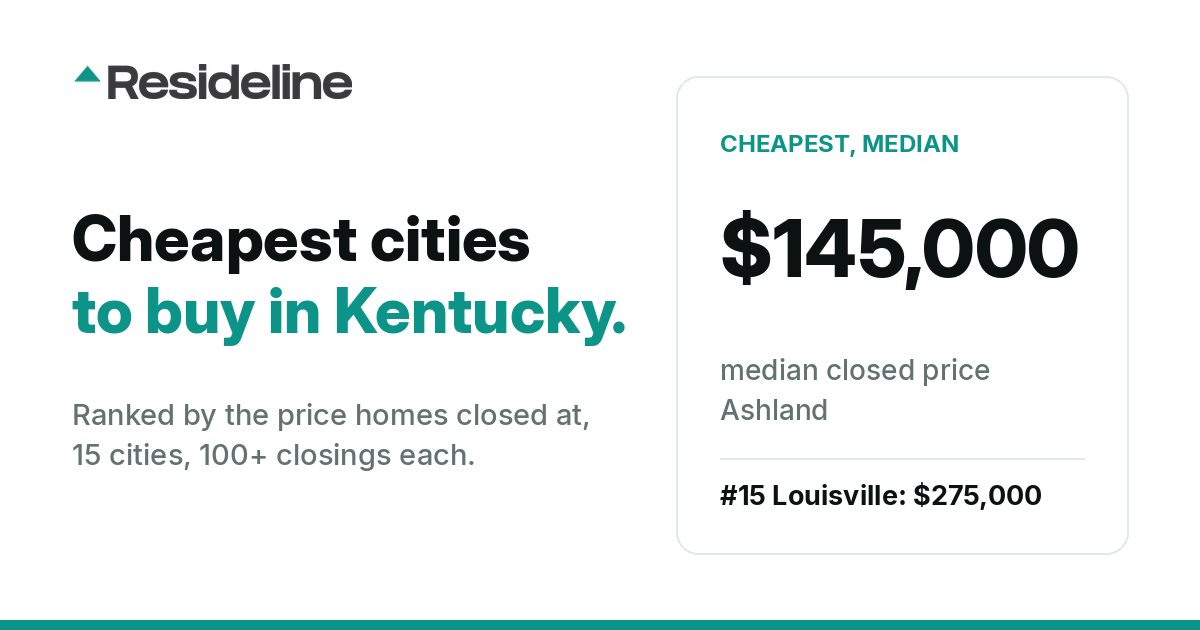
Cheapest Cities to Buy a House in Kentucky (2026)
The 15 cheapest Kentucky cities by median closed price, from $145,000 in Ashland to $275,000 in Louisville, with what houses cost per square foot, what resales did, and how fast listings go.
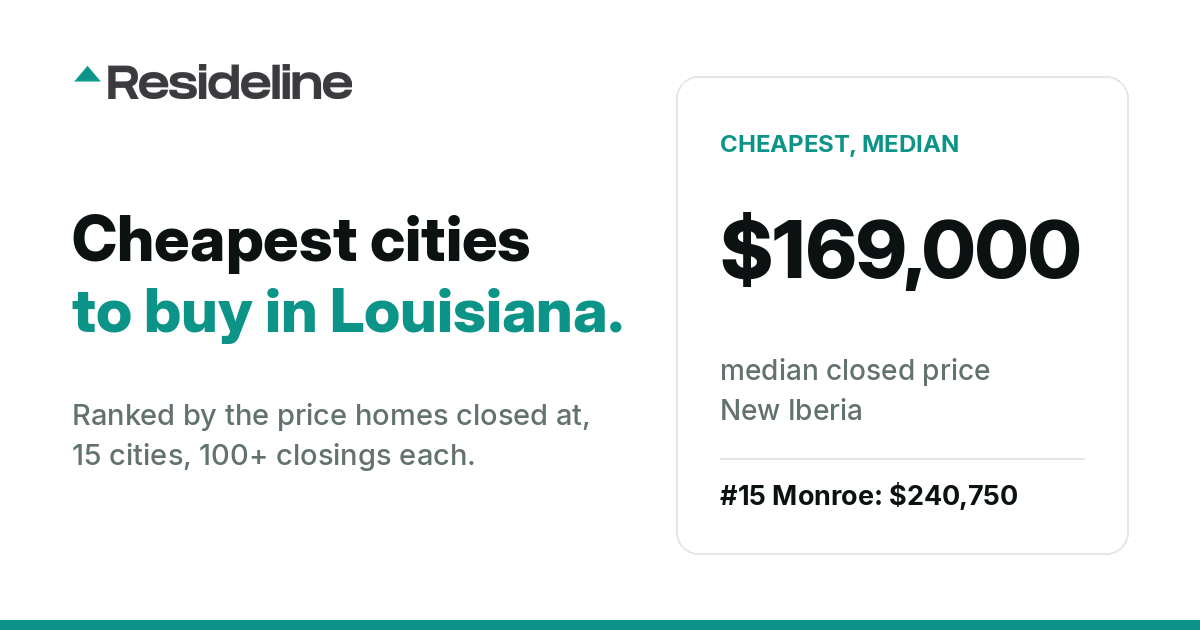
Cheapest Cities to Buy a House in Louisiana (2026)
The 15 cheapest Louisiana cities by median closed price, from $169,000 in New Iberia to $240,750 in Monroe, with what houses cost per square foot, what resales did, and how fast listings go.
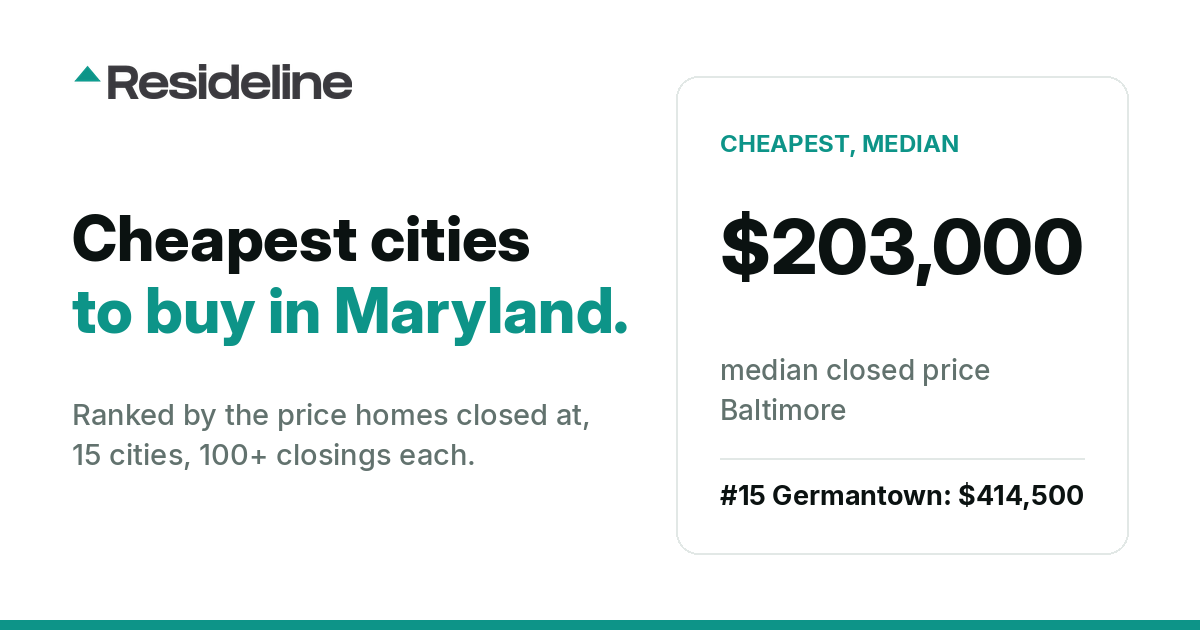
Cheapest Cities to Buy a House in Maryland (2026)
The 15 cheapest Maryland cities by median closed price, from $203,000 in Baltimore to $414,500 in Germantown, with what houses cost per square foot, what resales did, and how fast listings go.
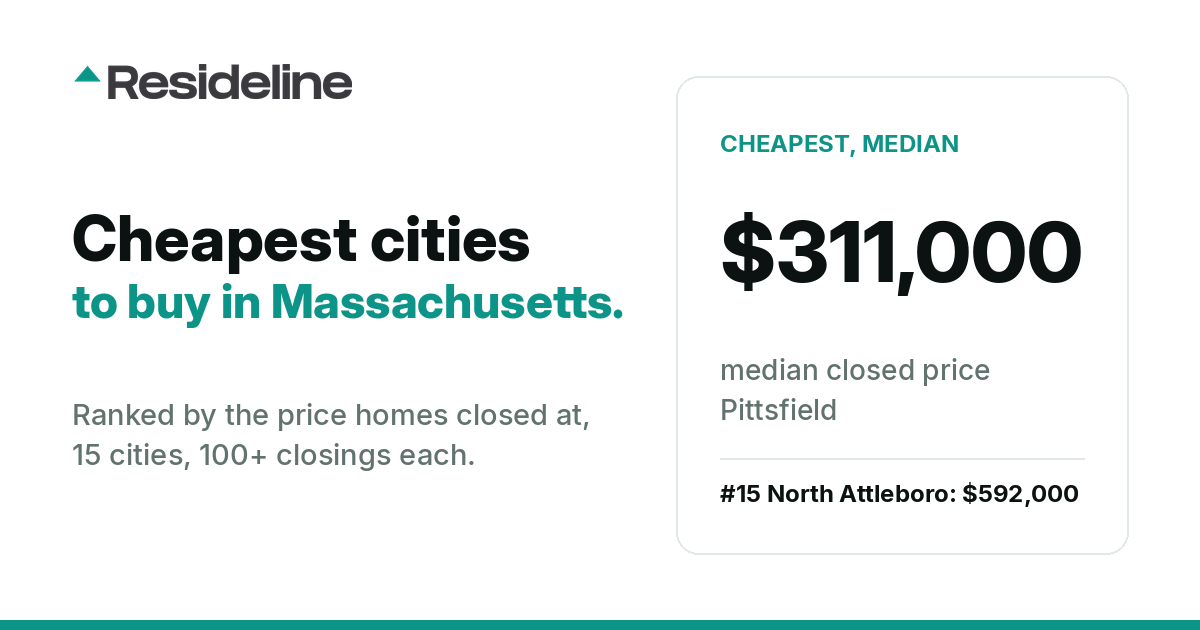
Cheapest Cities to Buy a House in Massachusetts (2026)
The 15 cheapest Massachusetts cities by median closed price, from $311,000 in Pittsfield to $592,000 in North Attleboro, with what houses cost per square foot, what resales did, and how fast listings go.
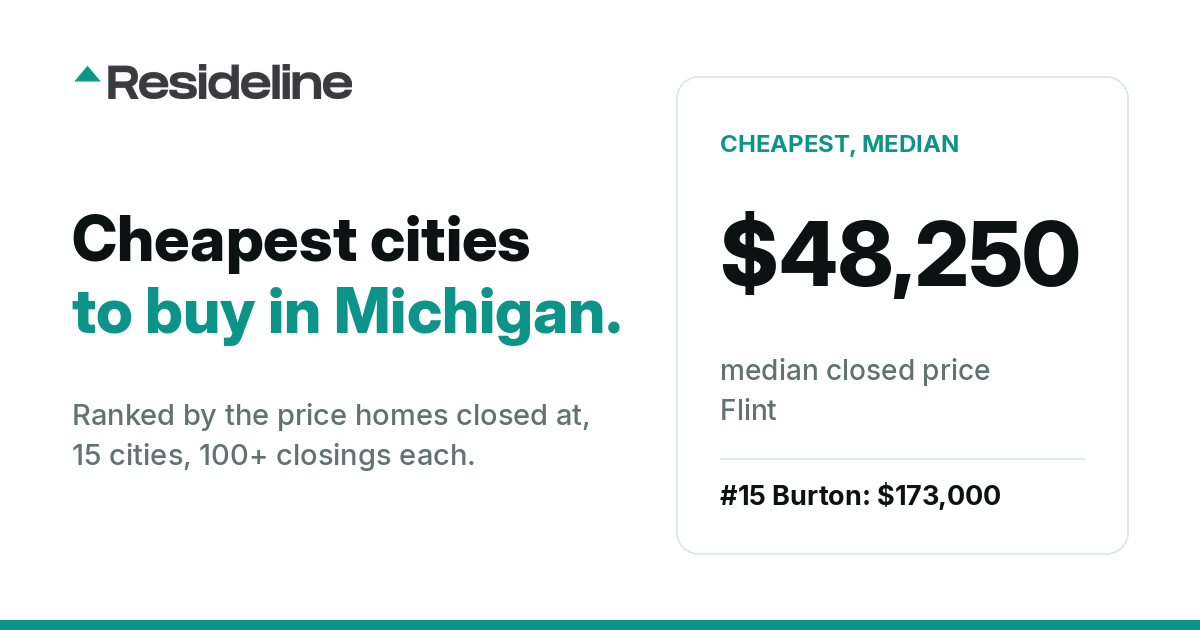
Cheapest Cities to Buy a House in Michigan (2026)
The 15 cheapest Michigan cities by median closed price, from $48,250 in Flint to $173,000 in Burton, with what houses cost per square foot, what resales did, and how fast listings go.
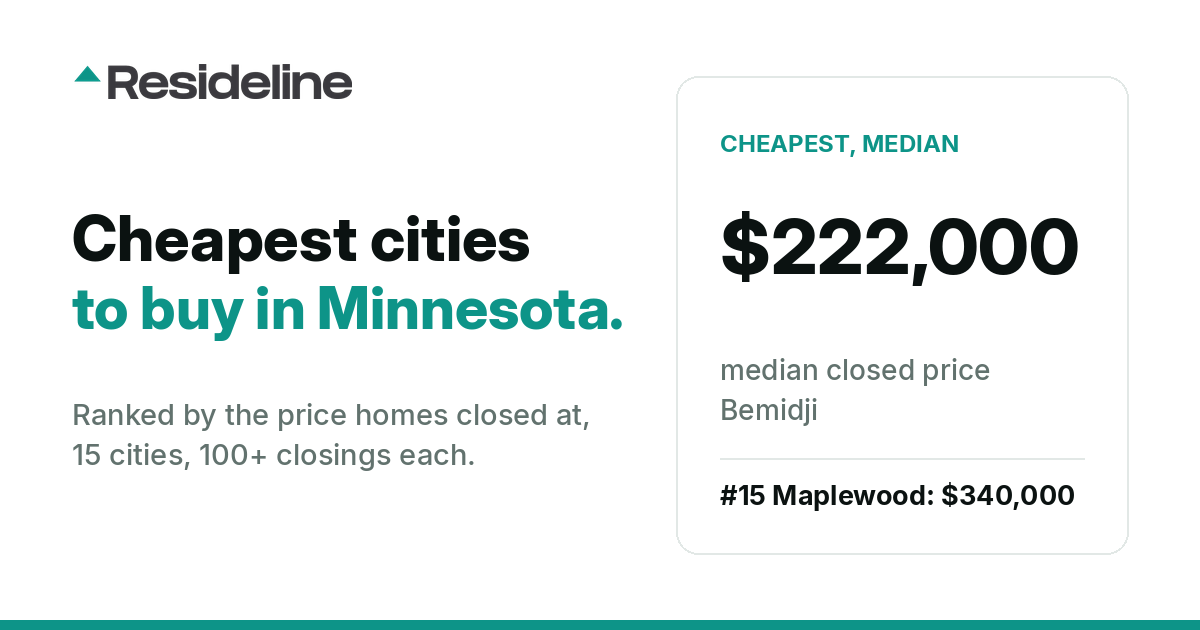
Cheapest Cities to Buy a House in Minnesota (2026)
The 15 cheapest Minnesota cities by median closed price, from $222,000 in Bemidji to $340,000 in Maplewood, with what houses cost per square foot, what resales did, and how fast listings go.
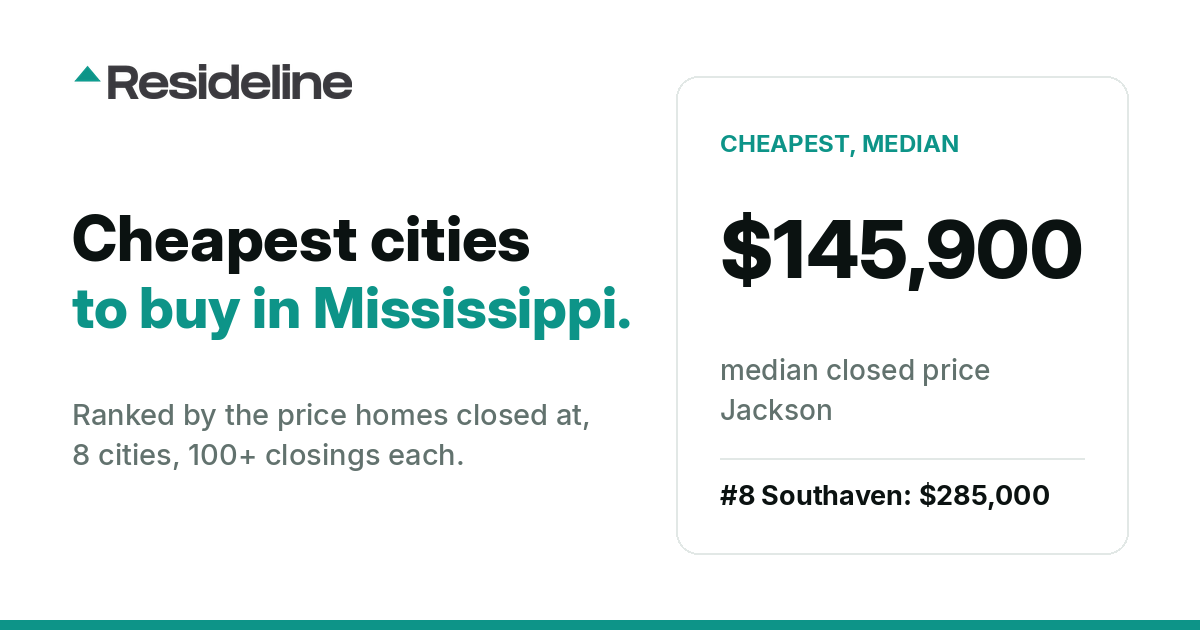
Cheapest Cities to Buy a House in Mississippi (2026)
The 8 cheapest Mississippi cities by median closed price, from $145,900 in Jackson to $285,000 in Southaven, with what houses cost per square foot, what resales did, and how fast listings go.
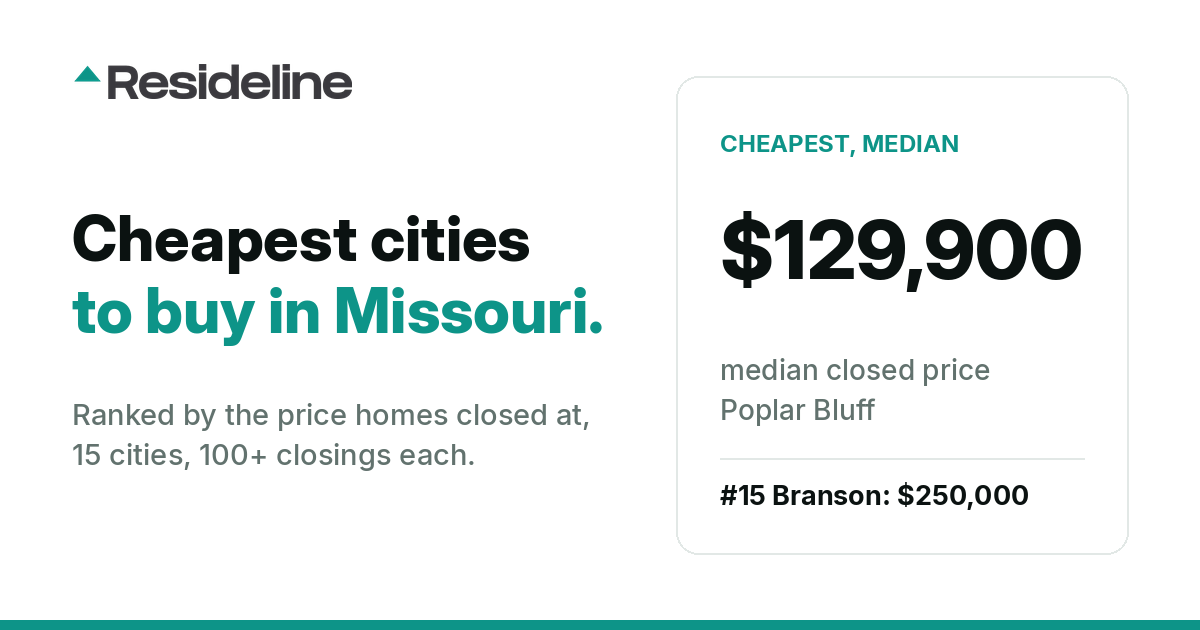
Cheapest Cities to Buy a House in Missouri (2026)
The 15 cheapest Missouri cities by median closed price, from $129,900 in Poplar Bluff to $250,000 in Branson, with what houses cost per square foot, what resales did, and how fast listings go.
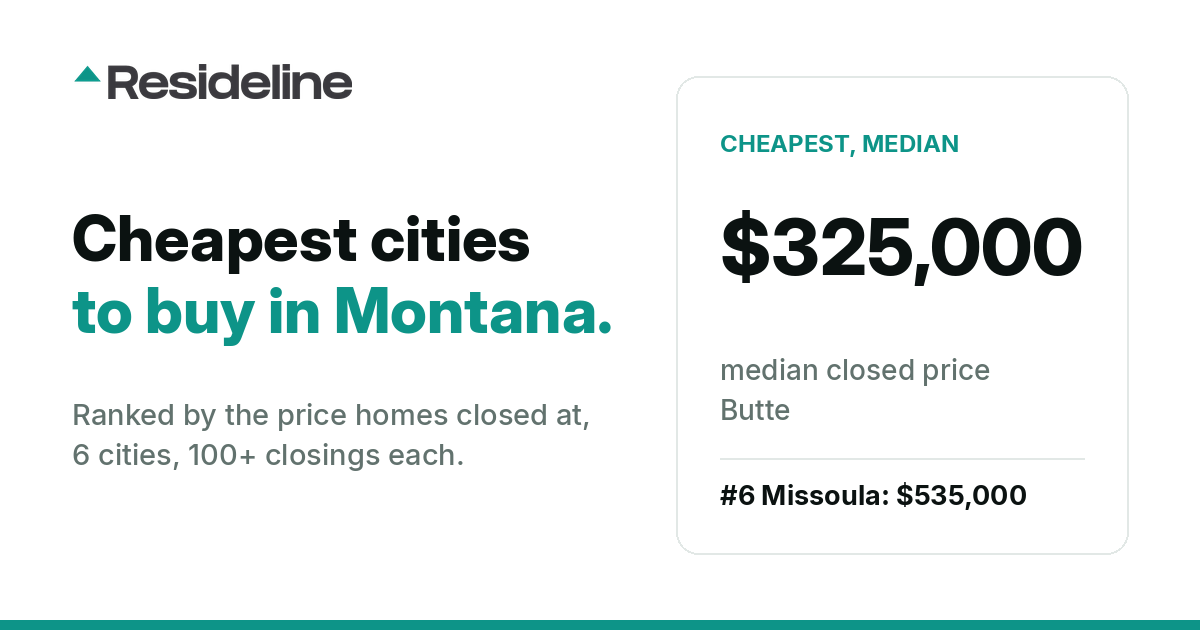
Cheapest Cities to Buy a House in Montana (2026)
The 6 cheapest Montana cities by median closed price, from $325,000 in Butte to $535,000 in Missoula, with what houses cost per square foot, what resales did, and how fast listings go.
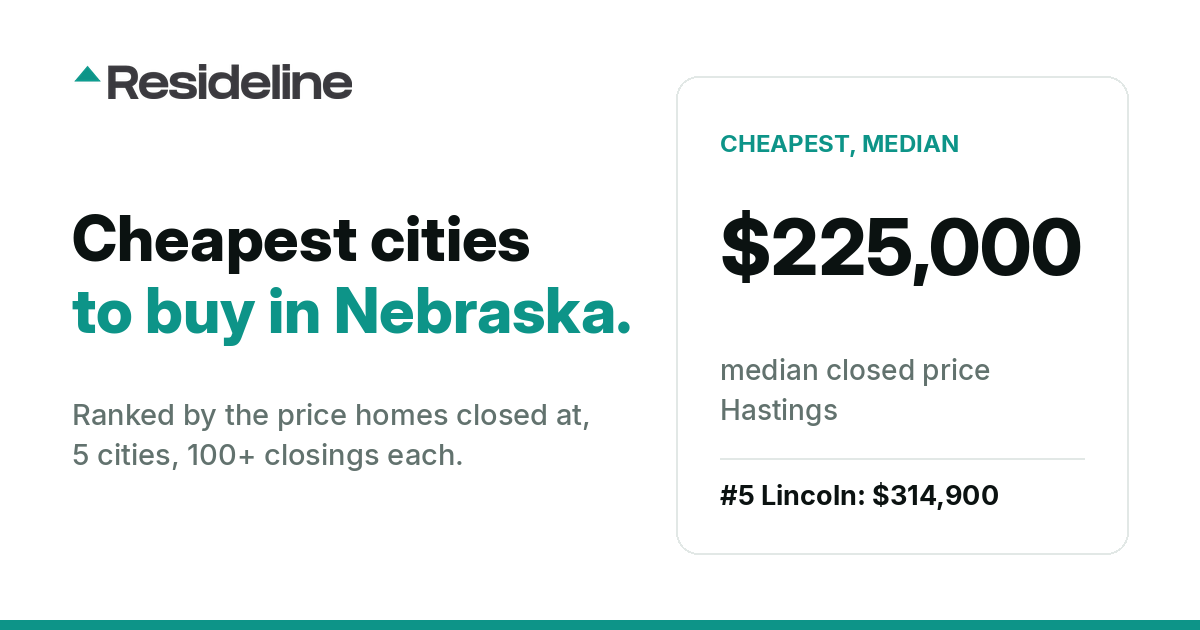
Cheapest Cities to Buy a House in Nebraska (2026)
The 5 cheapest Nebraska cities by median closed price, from $225,000 in Hastings to $314,900 in Lincoln, with what houses cost per square foot, what resales did, and how fast listings go.
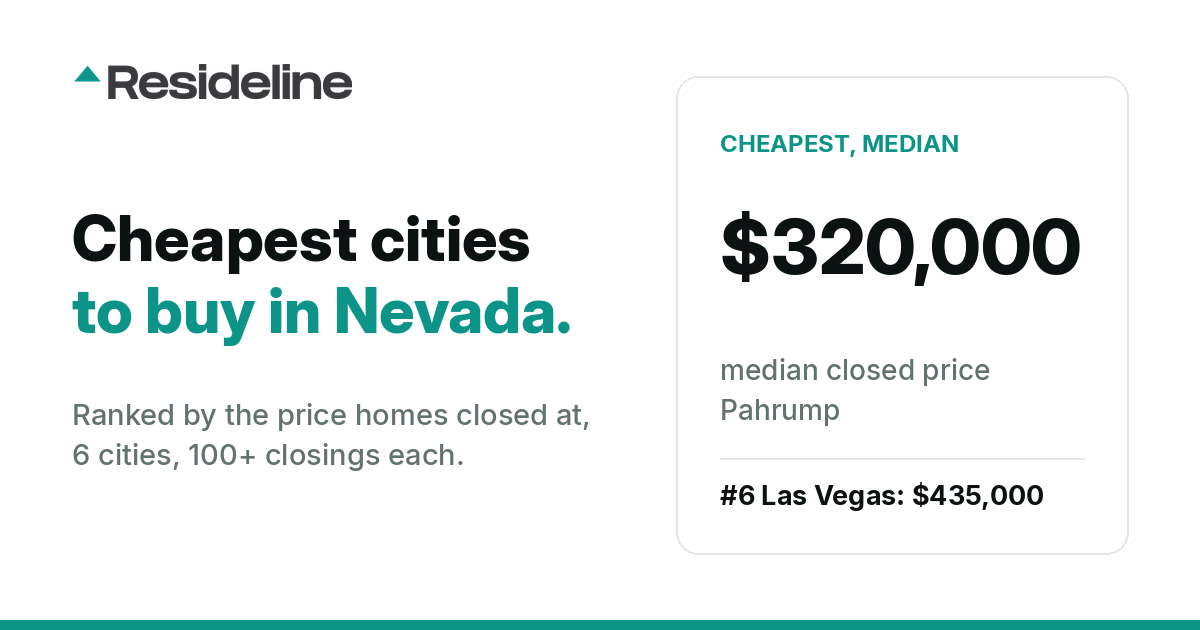
Cheapest Cities to Buy a House in Nevada (2026)
The 6 cheapest Nevada cities by median closed price, from $320,000 in Pahrump to $435,000 in Las Vegas, with what houses cost per square foot, what resales did, and how fast listings go.
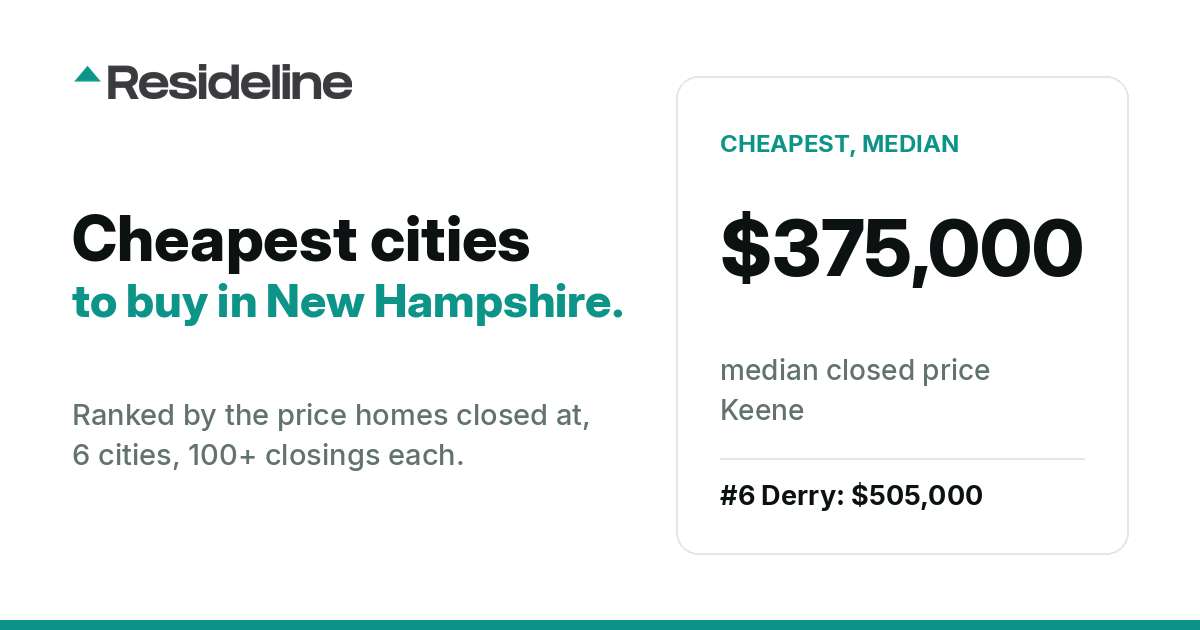
Cheapest Cities to Buy a House in New Hampshire (2026)
The 6 cheapest New Hampshire cities by median closed price, from $375,000 in Keene to $505,000 in Derry, with what houses cost per square foot, what resales did, and how fast listings go.
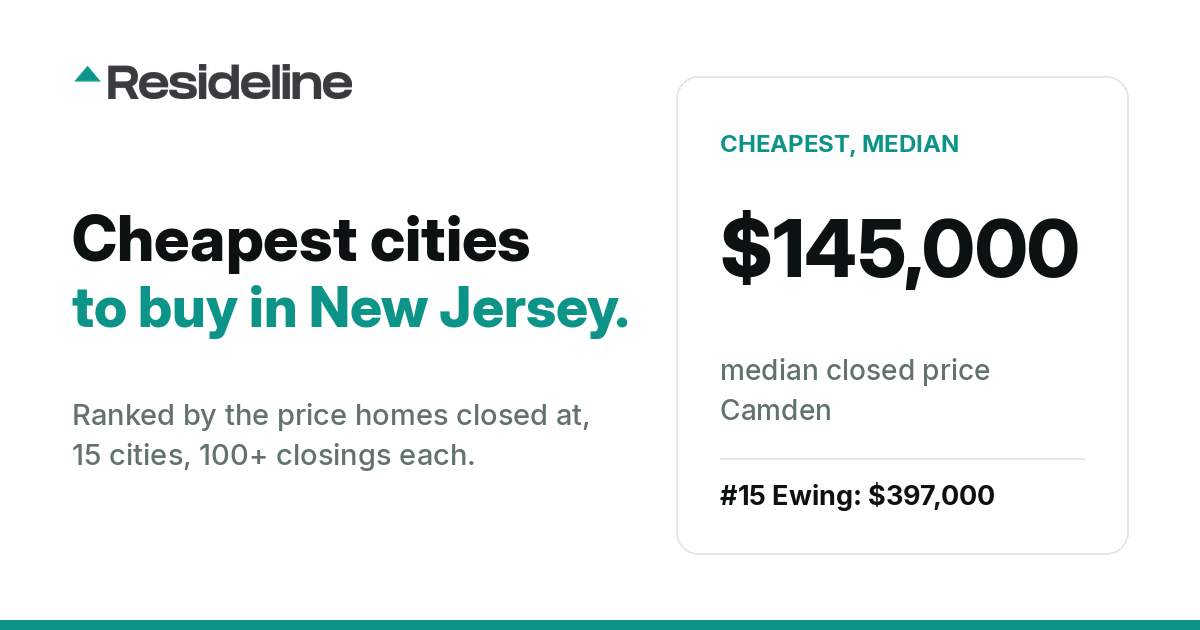
Cheapest Cities to Buy a House in New Jersey (2026)
The 15 cheapest New Jersey cities by median closed price, from $145,000 in Camden to $397,000 in Ewing, with what houses cost per square foot, what resales did, and how fast listings go.
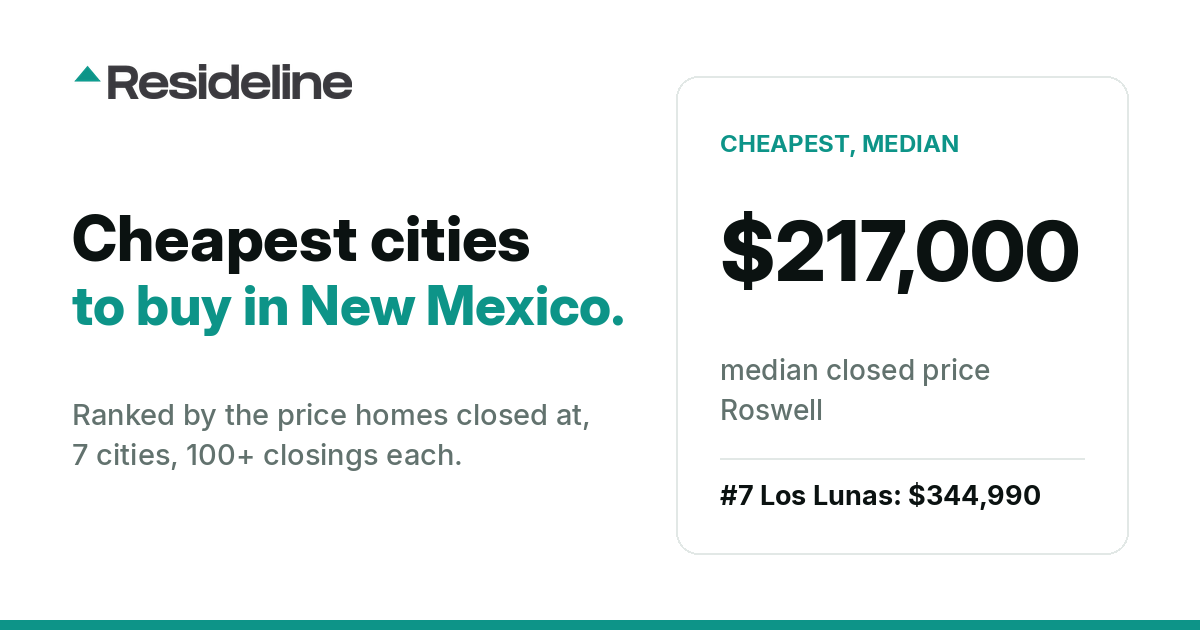
Cheapest Cities to Buy a House in New Mexico (2026)
The 7 cheapest New Mexico cities by median closed price, from $217,000 in Roswell to $344,990 in Los Lunas, with what houses cost per square foot, what resales did, and how fast listings go.
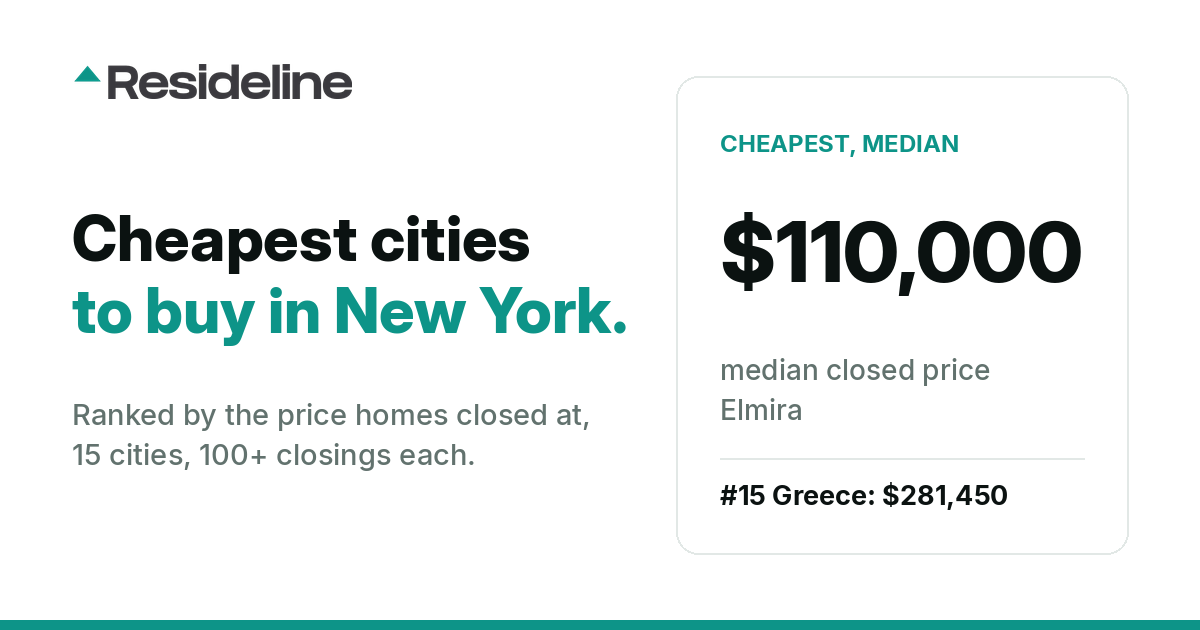
Cheapest Cities to Buy a House in New York (2026)
The 15 cheapest New York cities by median closed price, from $110,000 in Elmira to $281,450 in Greece, with what houses cost per square foot, what resales did, and how fast listings go.
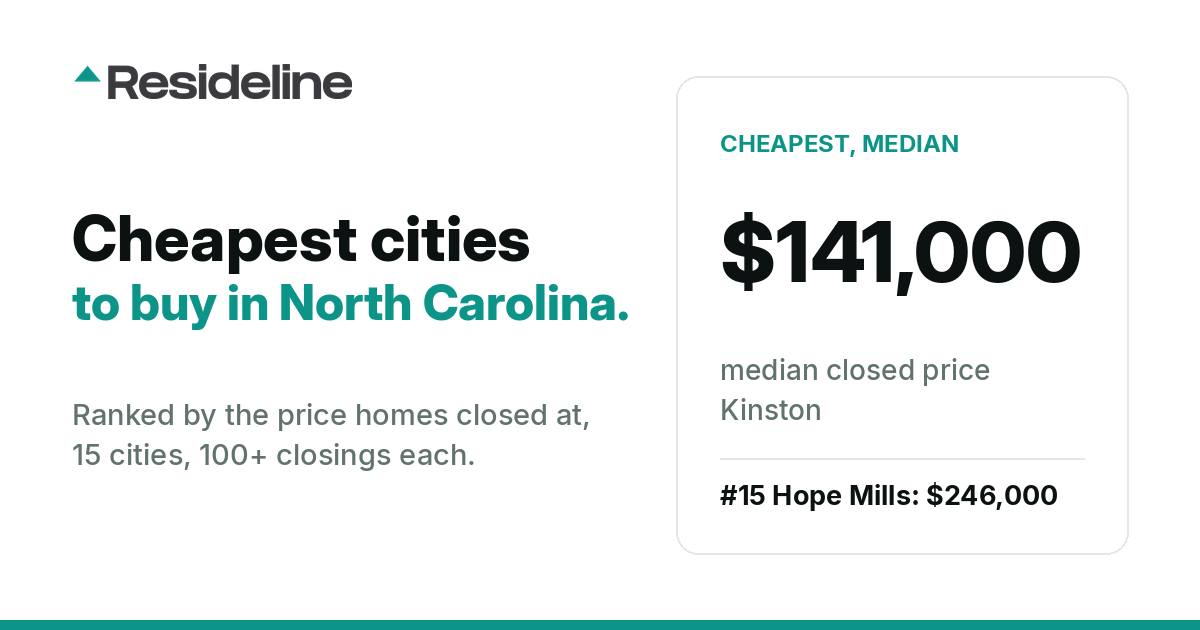
Cheapest Cities to Buy a House in North Carolina (2026)
The 15 cheapest North Carolina cities by median closed price, from $141,000 in Kinston to $246,000 in Hope Mills, with what houses cost per square foot, what resales did, and how fast listings go.
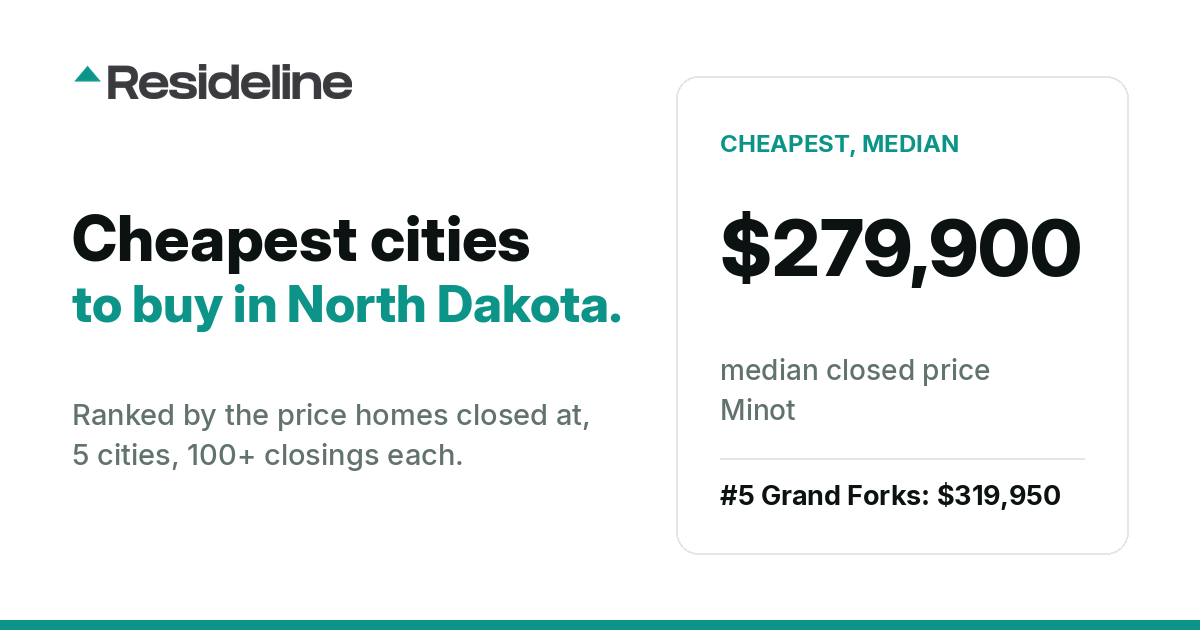
Cheapest Cities to Buy a House in North Dakota (2026)
The 5 cheapest North Dakota cities by median closed price, from $279,900 in Minot to $319,950 in Grand Forks, with what houses cost per square foot, what resales did, and how fast listings go.
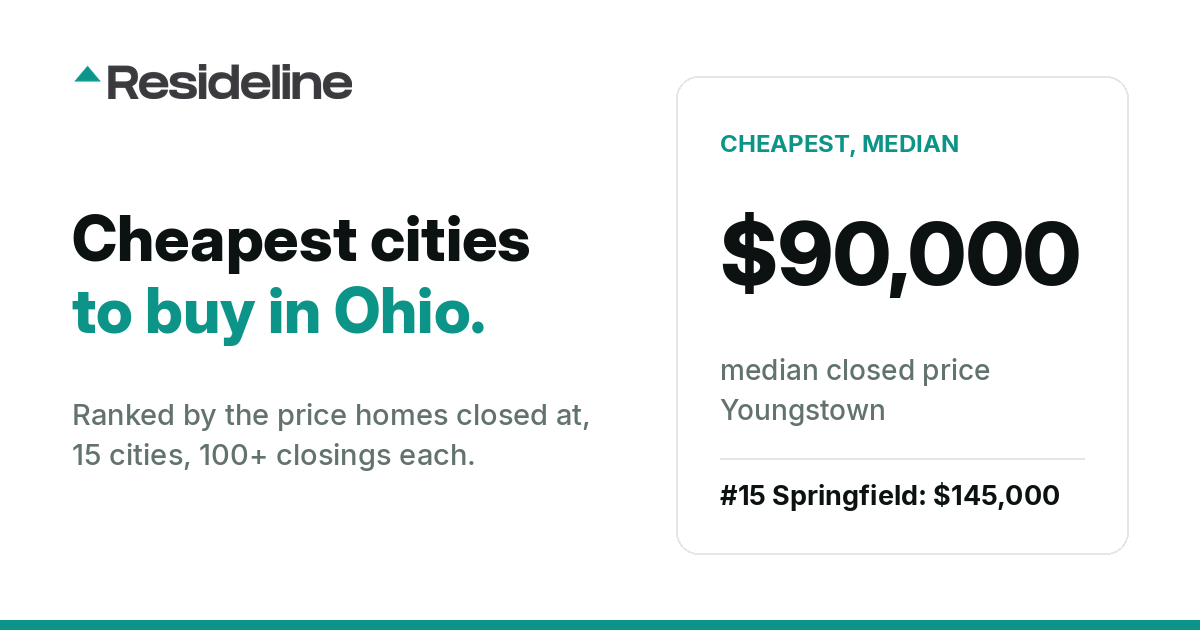
Cheapest Cities to Buy a House in Ohio (2026)
The 15 cheapest Ohio cities by median closed price, from $90,000 in Youngstown to $145,000 in Springfield, with what houses cost per square foot, what resales did, and how fast listings go.
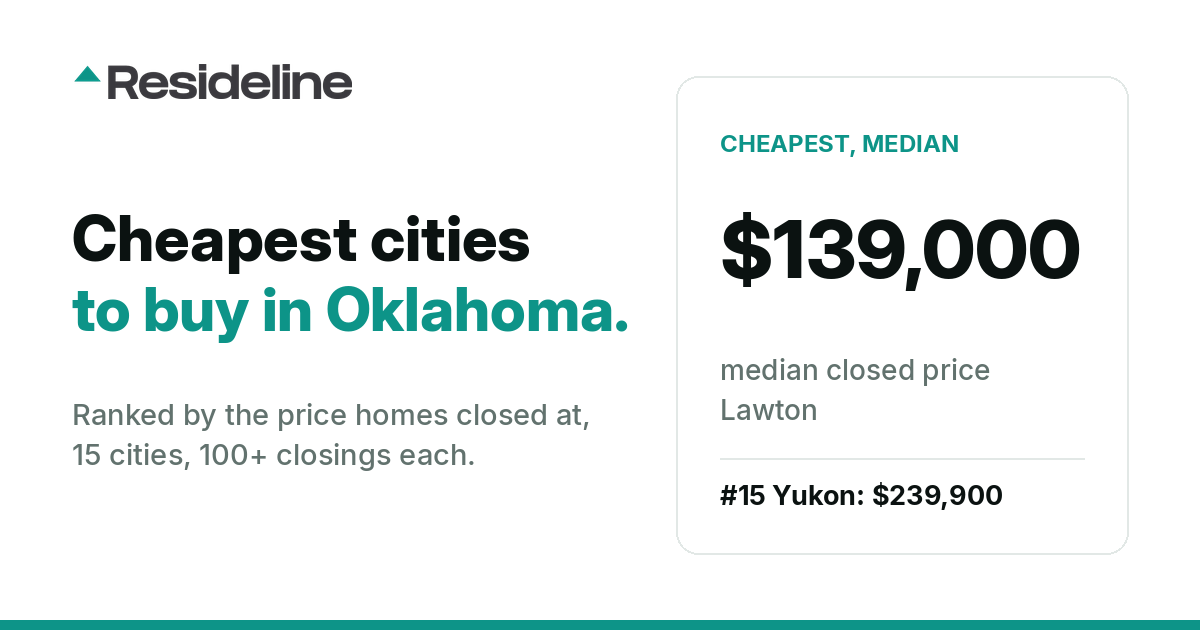
Cheapest Cities to Buy a House in Oklahoma (2026)
The 15 cheapest Oklahoma cities by median closed price, from $139,000 in Lawton to $239,900 in Yukon, with what houses cost per square foot, what resales did, and how fast listings go.
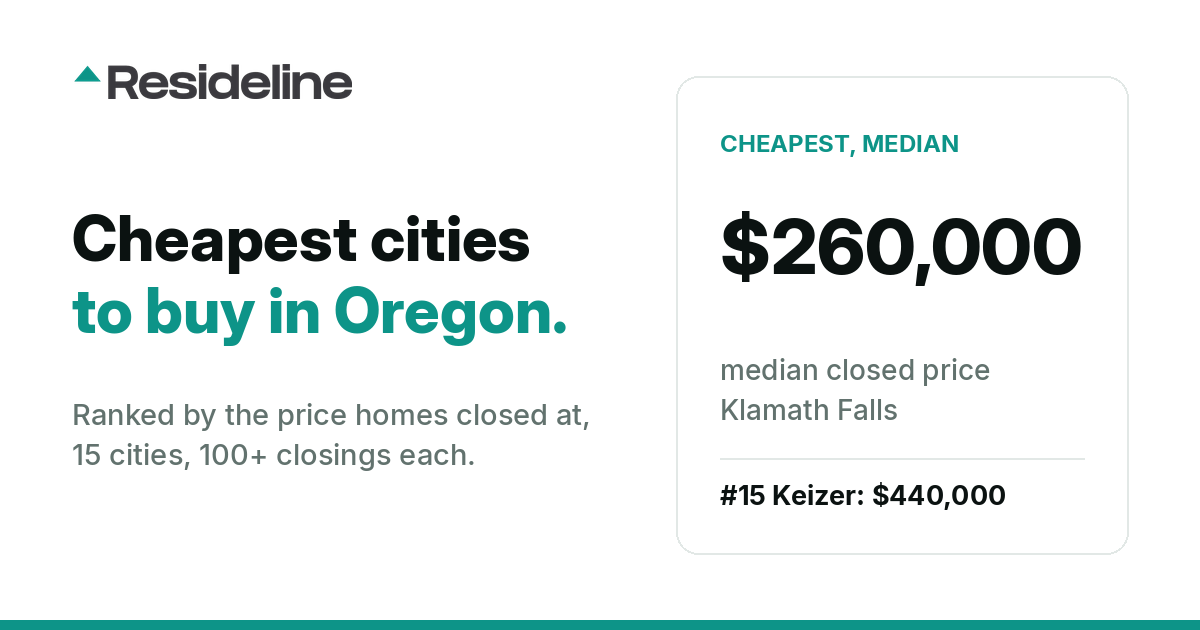
Cheapest Cities to Buy a House in Oregon (2026)
The 15 cheapest Oregon cities by median closed price, from $260,000 in Klamath Falls to $440,000 in Keizer, with what houses cost per square foot, what resales did, and how fast listings go.
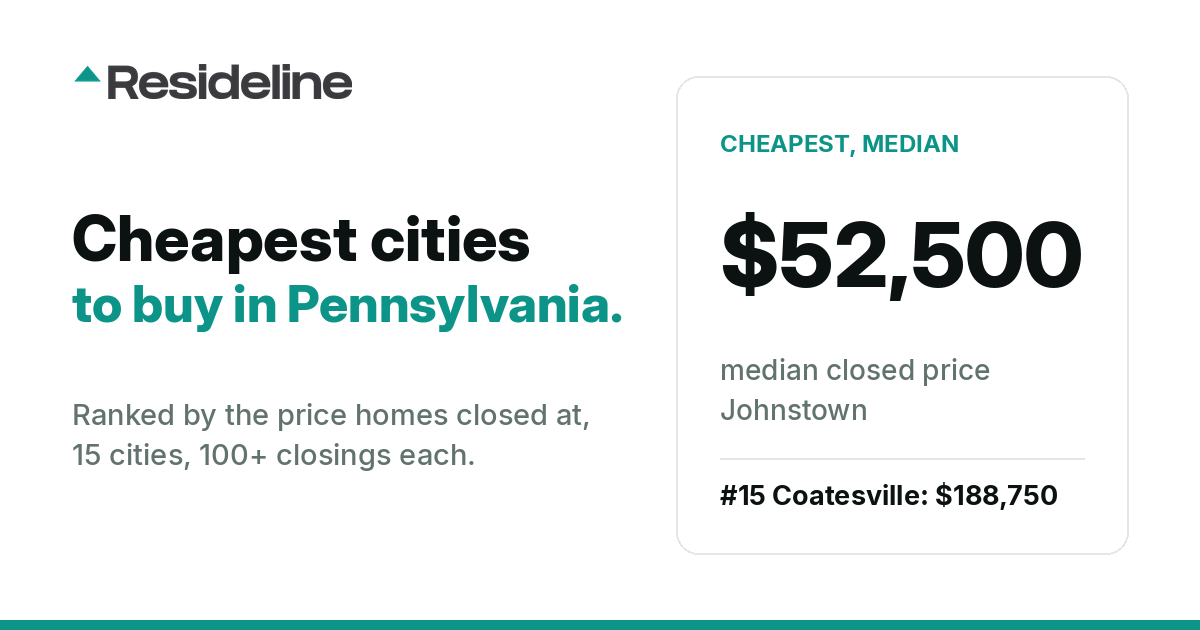
Cheapest Cities to Buy a House in Pennsylvania (2026)
The 15 cheapest Pennsylvania cities by median closed price, from $52,500 in Johnstown to $188,750 in Coatesville, with what houses cost per square foot, what resales did, and how fast listings go.
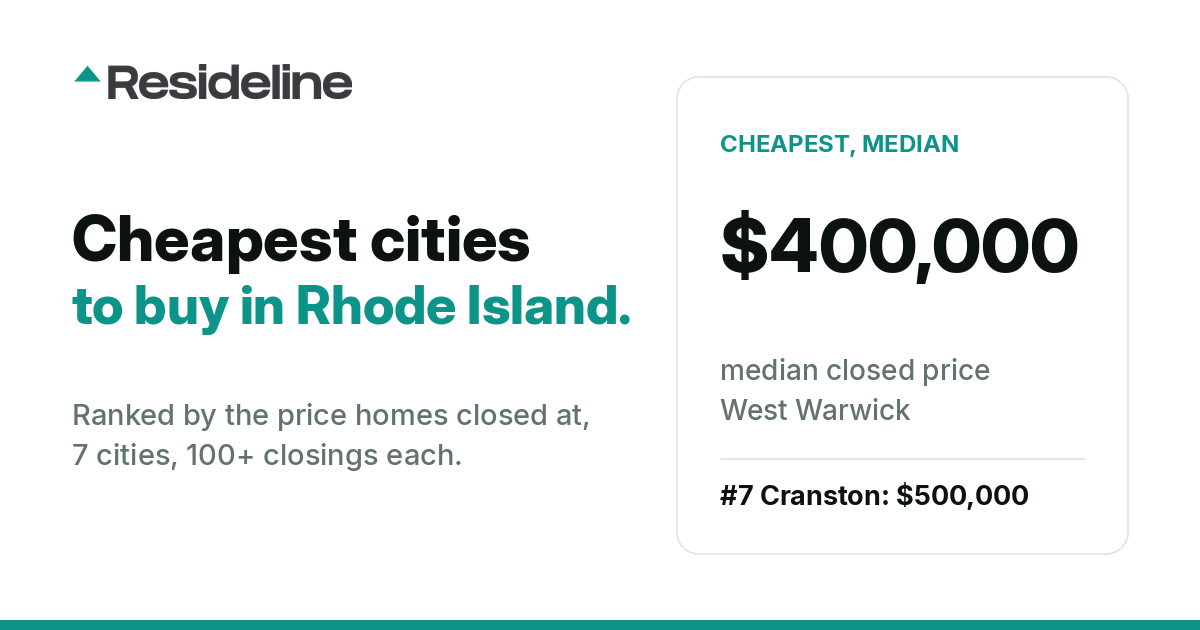
Cheapest Cities to Buy a House in Rhode Island (2026)
The 7 cheapest Rhode Island cities by median closed price, from $400,000 in West Warwick to $500,000 in Cranston, with what houses cost per square foot, what resales did, and how fast listings go.
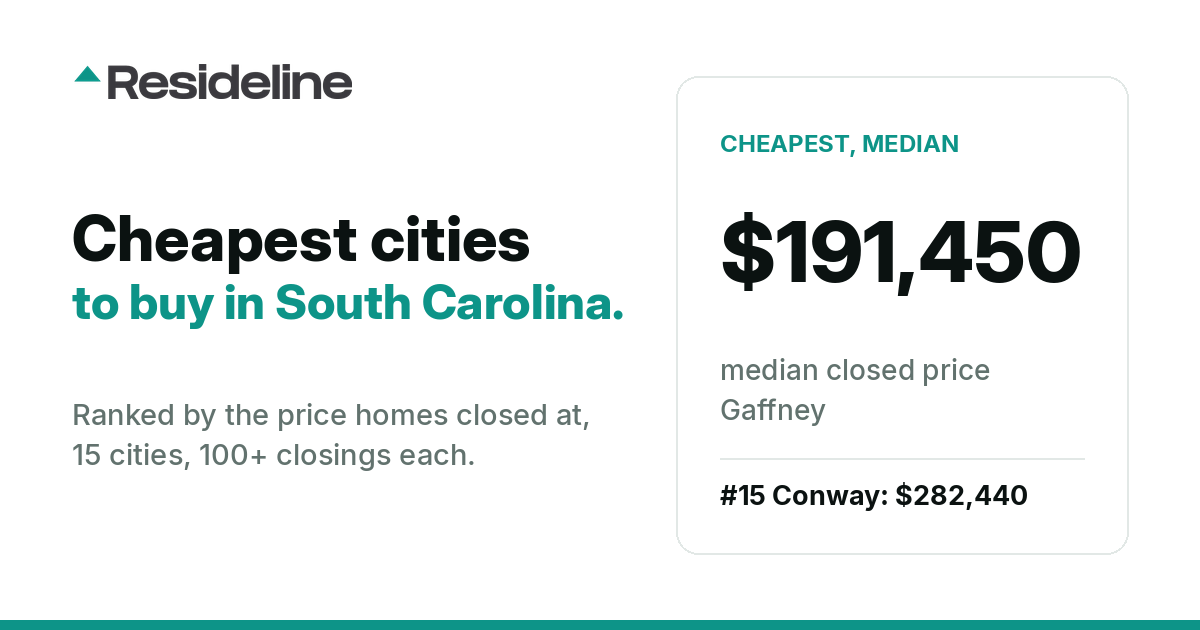
Cheapest Cities to Buy a House in South Carolina (2026)
The 15 cheapest South Carolina cities by median closed price, from $191,450 in Gaffney to $282,440 in Conway, with what houses cost per square foot, what resales did, and how fast listings go.
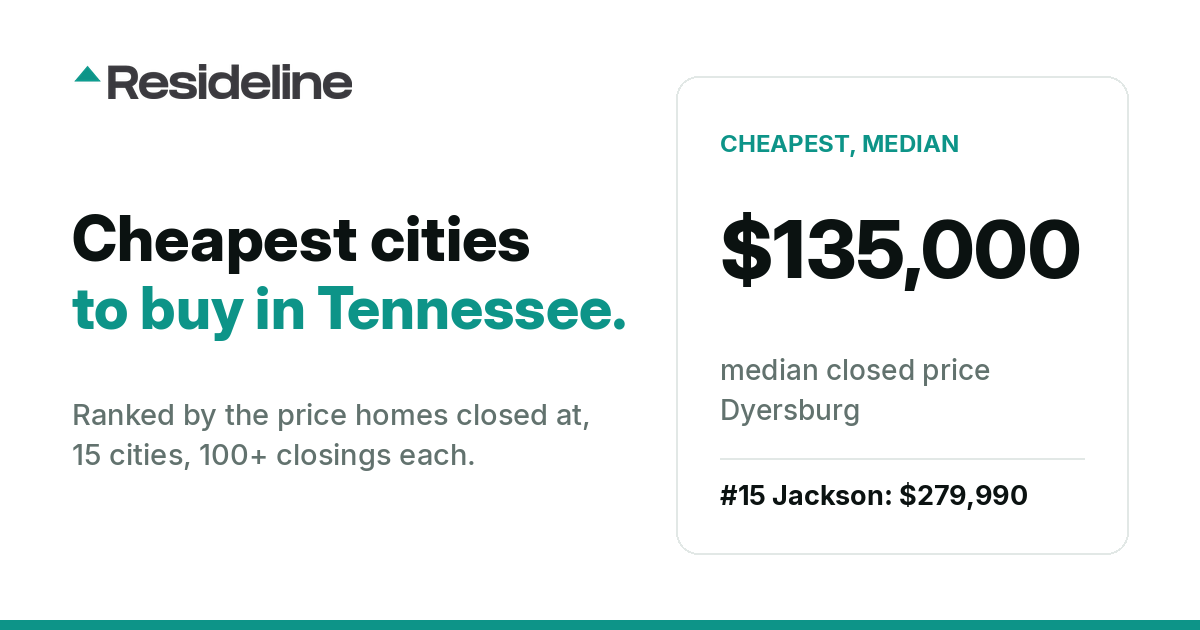
Cheapest Cities to Buy a House in Tennessee (2026)
The 15 cheapest Tennessee cities by median closed price, from $135,000 in Dyersburg to $279,990 in Jackson, with what houses cost per square foot, what resales did, and how fast listings go.
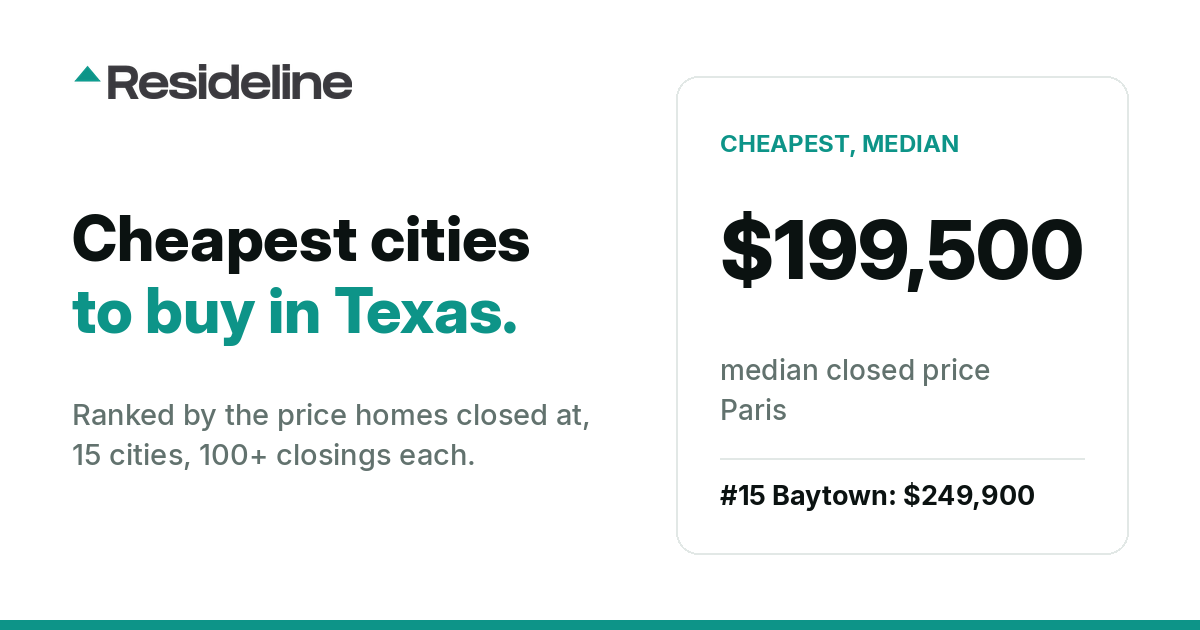
Cheapest Cities to Buy a House in Texas (2026)
The 15 cheapest Texas cities by median closed price, from $199,500 in Paris to $249,900 in Baytown, with what houses cost per square foot, what resales did, and how fast listings go.
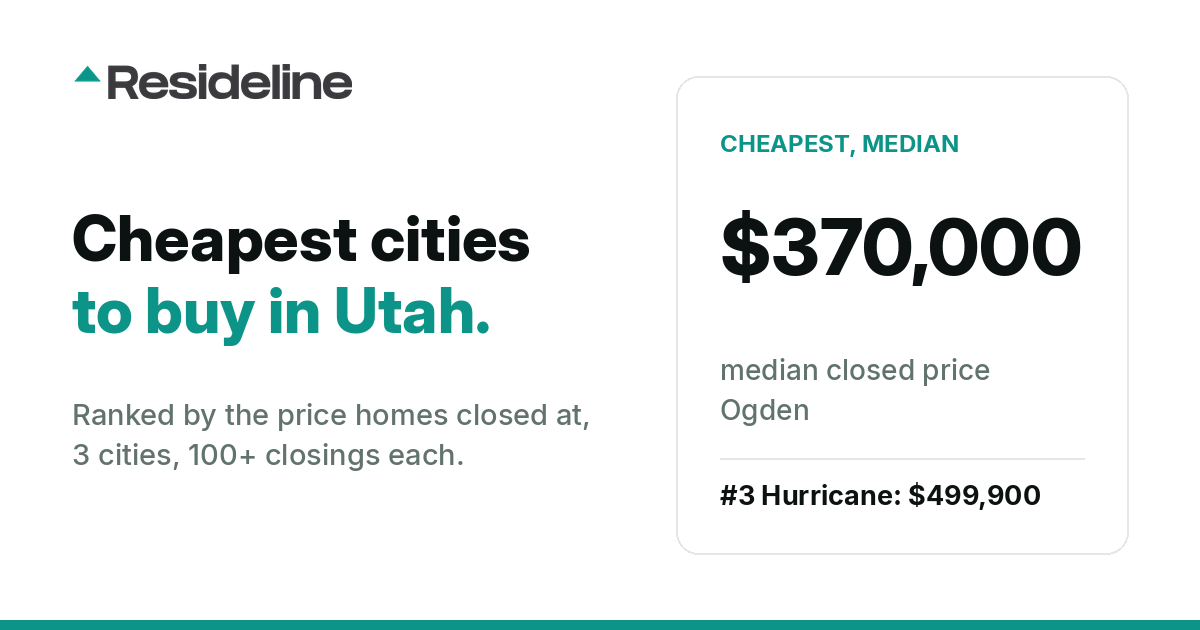
Cheapest Cities to Buy a House in Utah (2026)
The 3 cheapest Utah cities by median closed price, from $370,000 in Ogden to $499,900 in Hurricane, with what houses cost per square foot, what resales did, and how fast listings go.
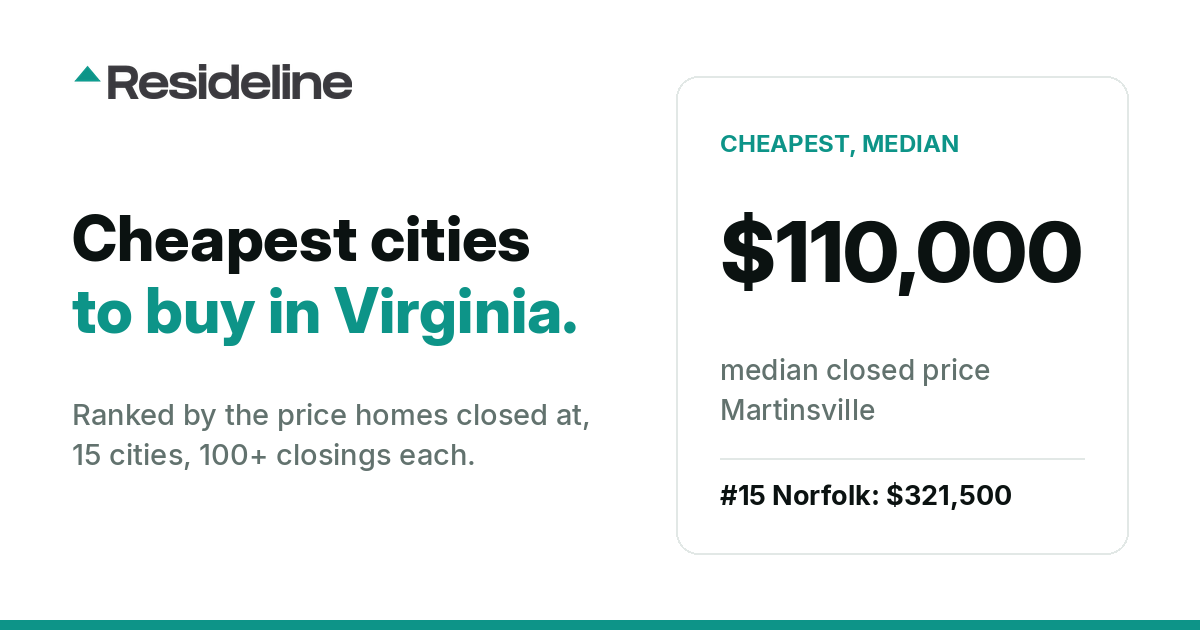
Cheapest Cities to Buy a House in Virginia (2026)
The 15 cheapest Virginia cities by median closed price, from $110,000 in Martinsville to $321,500 in Norfolk, with what houses cost per square foot, what resales did, and how fast listings go.
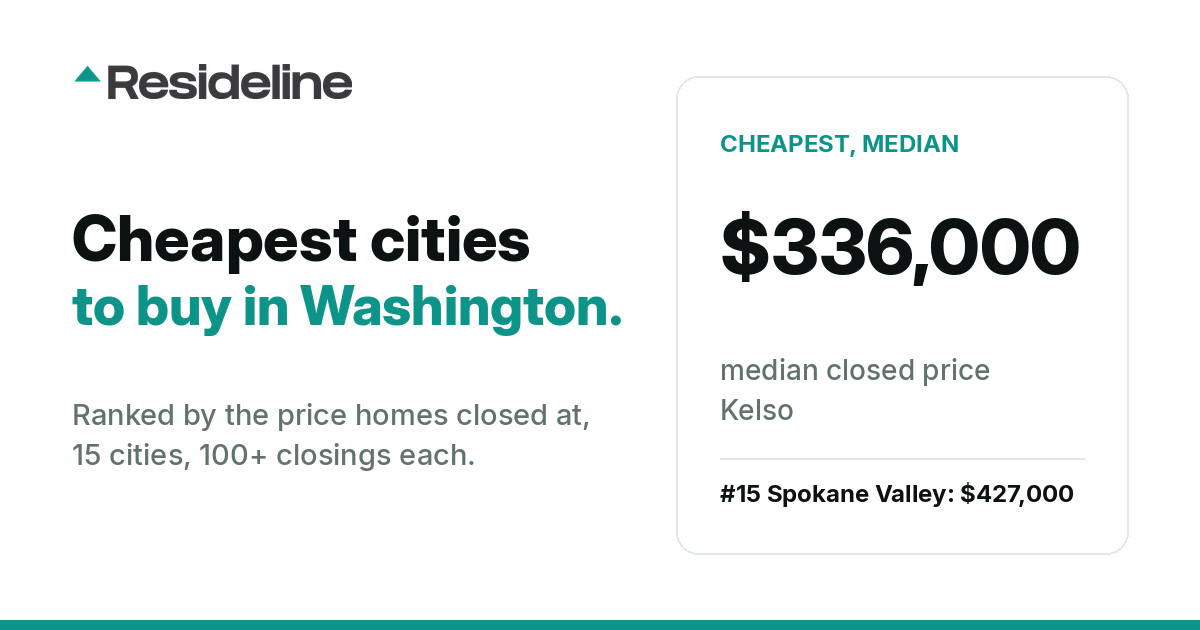
Cheapest Cities to Buy a House in Washington (2026)
The 15 cheapest Washington cities by median closed price, from $336,000 in Kelso to $427,000 in Spokane Valley, with what houses cost per square foot, what resales did, and how fast listings go.
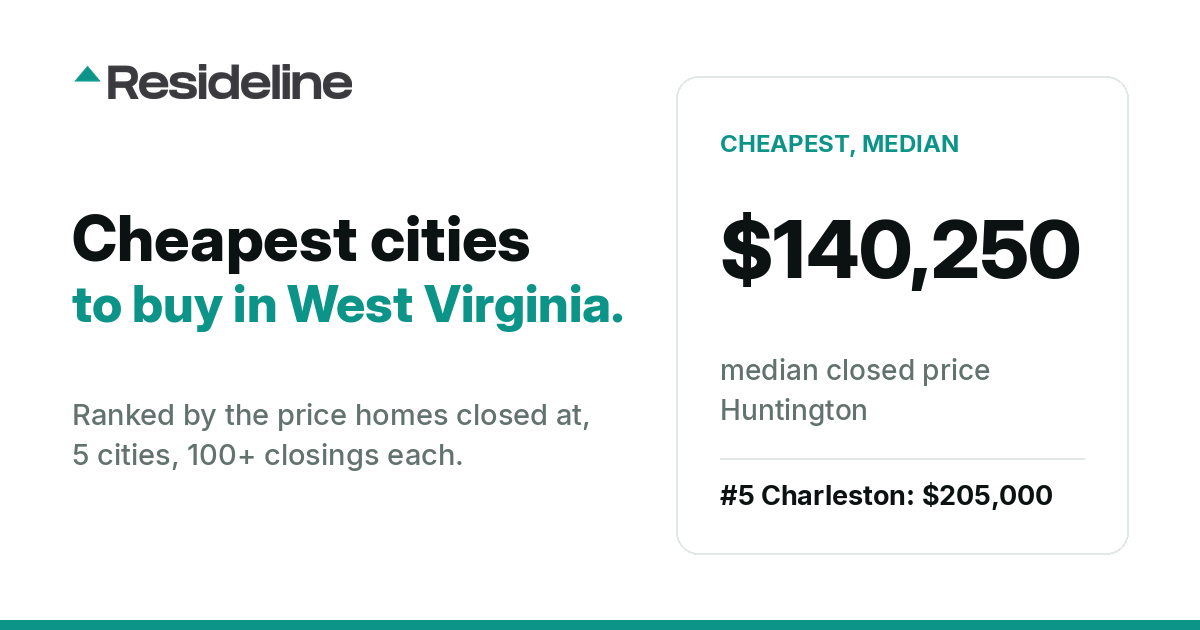
Cheapest Cities to Buy a House in West Virginia (2026)
The 5 cheapest West Virginia cities by median closed price, from $140,250 in Huntington to $205,000 in Charleston, with what houses cost per square foot, what resales did, and how fast listings go.
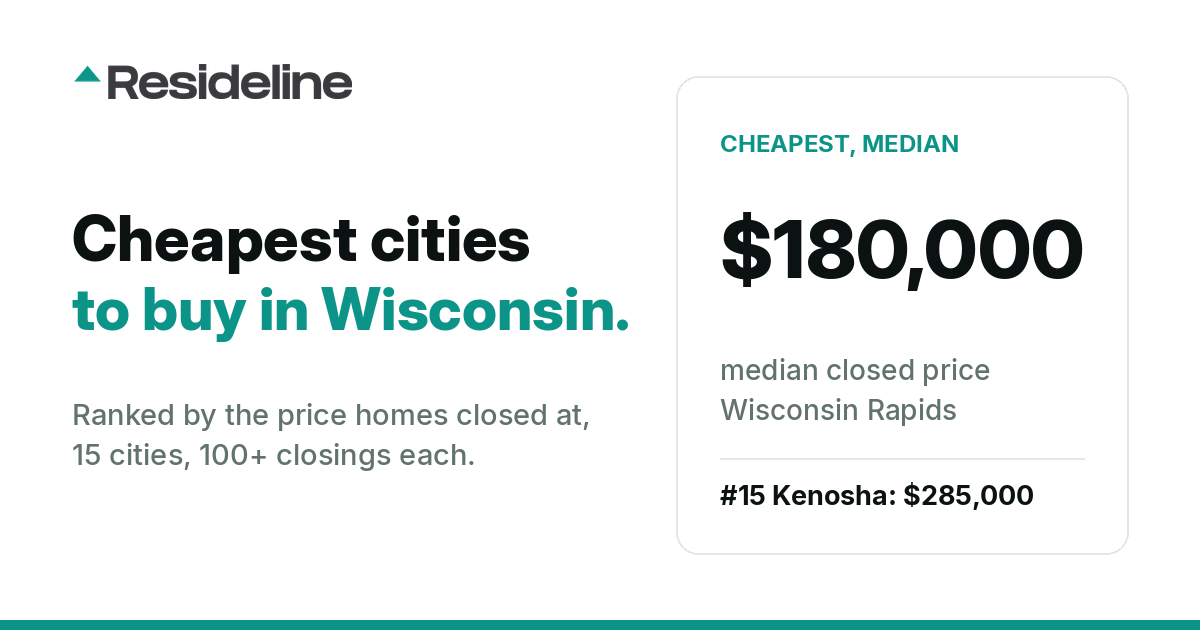
Cheapest Cities to Buy a House in Wisconsin (2026)
The 15 cheapest Wisconsin cities by median closed price, from $180,000 in Wisconsin Rapids to $285,000 in Kenosha, with what houses cost per square foot, what resales did, and how fast listings go.
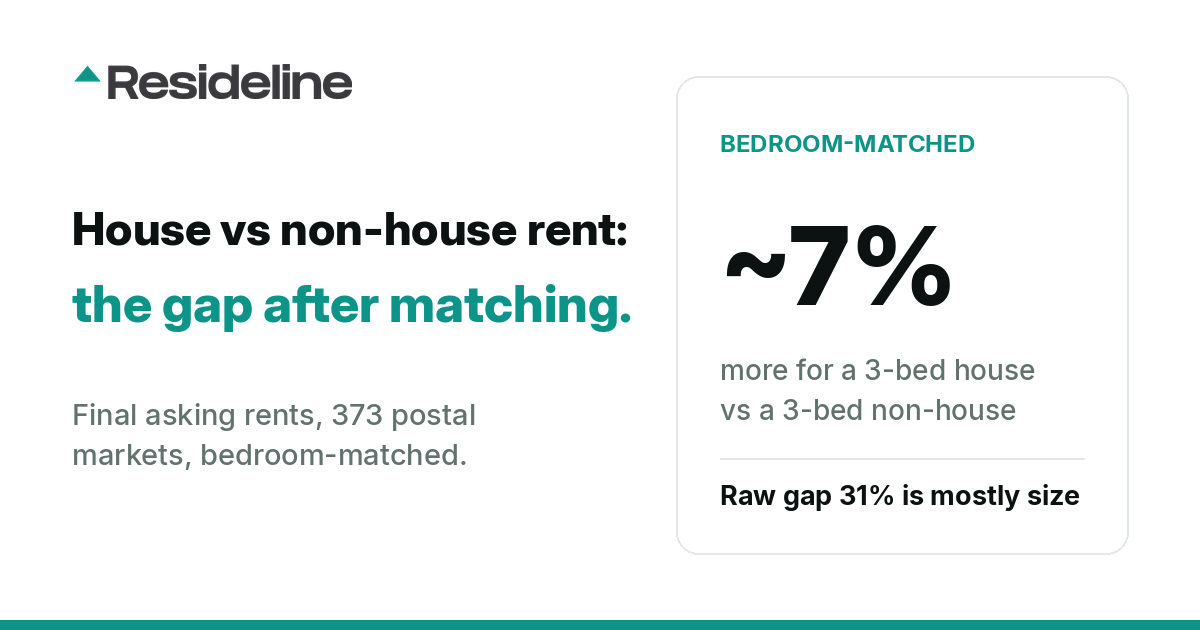
The House Rent Premium Shrinks to About 7% After Matching Bedrooms
Renting a house costs more than renting a comparable non-house unit in most qualifying markets, but far less than the raw numbers suggest. Among 373 postal markets with at least 50 removed 3-bedroom house rental listings and 50 removed 3-bedroom non-house rental listings over the 24 months to July 2026, the median Observed rent for 3-bedroom houses was about 7 percent higher than for 3-bedroom non-house stock (condos, townhomes, and other types). The raw house-vs-non-house gap looks like about 31 percent, but roughly three-quarters of that disappears once you compare same-bedroom rentals, pointing to unit size rather than property type as most of the raw gap (bedroom-matching does not fully isolate size).

Did Homes Beat Inflation? 71% of Measured Home Resales Did
Homes are sold as an inflation hedge, and at the market level the deed record agrees: 99.78% of 3,196 qualifying postal markets have a positive median real return. But that hides who actually won. When we deflated all 5,958,008 individual repeat-sale ownership windows by each pair's own CPI window, only about 71% beat inflation and roughly 29% lost. Whether you cleared the bar varied sharply by purchase decade: purchases in the 2010s beat inflation 86.8% of the time, while 2000s purchases were close to a coin flip at 52.8%.

Cash Flow or Growth: The Two Tend to Trade Off
Investors want markets that pay rent today and have appreciated for decades. Across 541 US cities (postal areas), gross rental yield and realized appreciation anti-correlate (Pearson -0.26), and only about 117 cities clear both medians, 12.9% fewer than chance would predict. We joined 12-month final-asking-rent yields with deed repeat-sale appreciation histories to measure the trade-off.
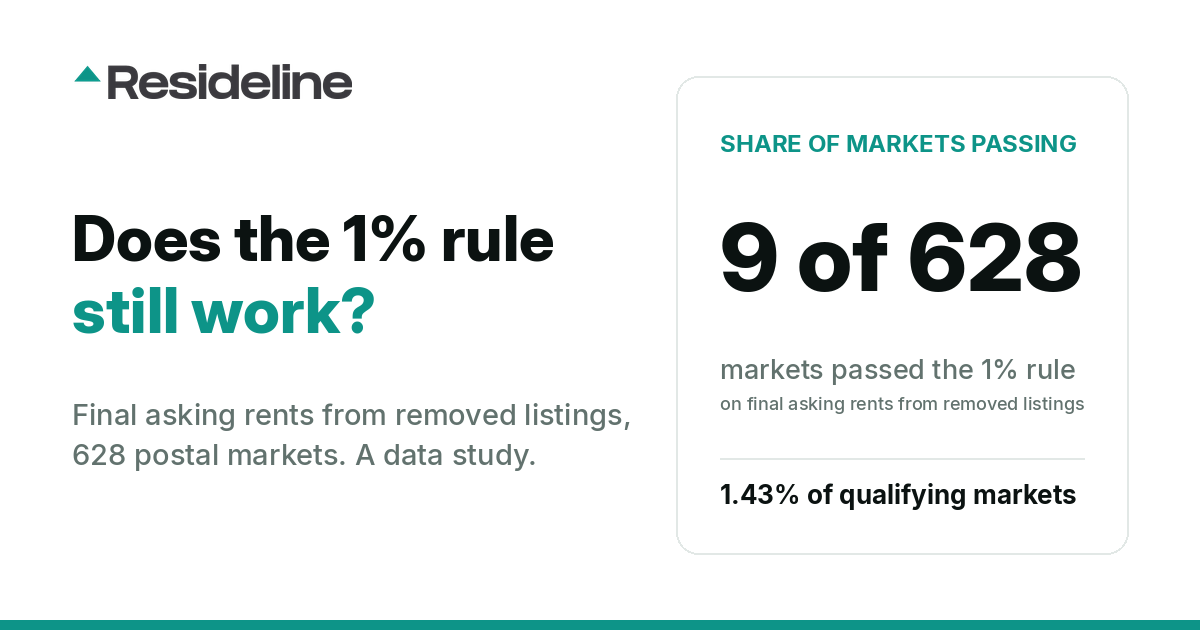
Does the 1% Rule Still Work? It Survives in 9 of 628 Markets
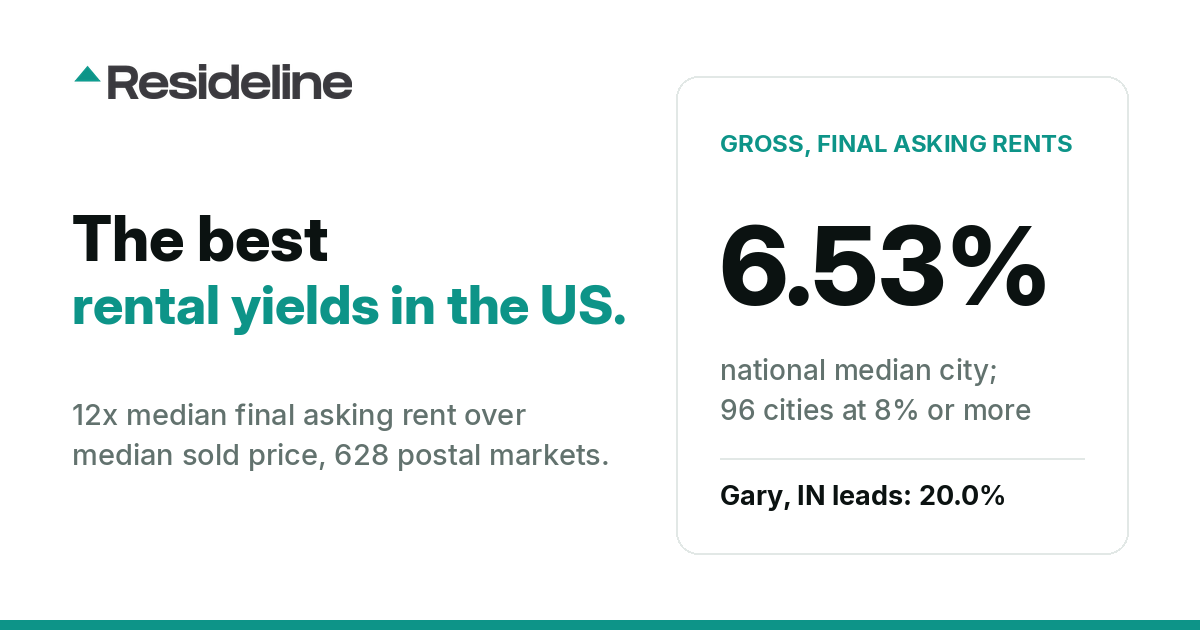
The 1 percent rule says a rental should gross monthly rent of at least 1 percent of its price. Tested against 12 months of observed rents from rental listings that left the market in 628 US cities (postal areas), it survives in exactly 9, or 1.43 percent. The median city yields 6.53 percent gross, about half of what the rule demands.
The Best Rental Yields in America: 628 Cities Ranked by Observed rent
Across the 628 qualifying US postal markets, the median gross rental yield was 6.53 percent over the past 12 months, and the top market, Gary, Indiana, reached 20 percent. We ranked these cities (postal areas) by dividing 12 times the median Observed rent, drawn from roughly 3 million rental listings that left the market, by the median sold home price. It is a market-level gross rent-to-price ratio, a gross-yield proxy, not a property-level yield. No asking-rent inflation, no forecasts.
Rent vs Buy, Measured City by City: Observed rents Covered P&I in 61% of 628 Cities
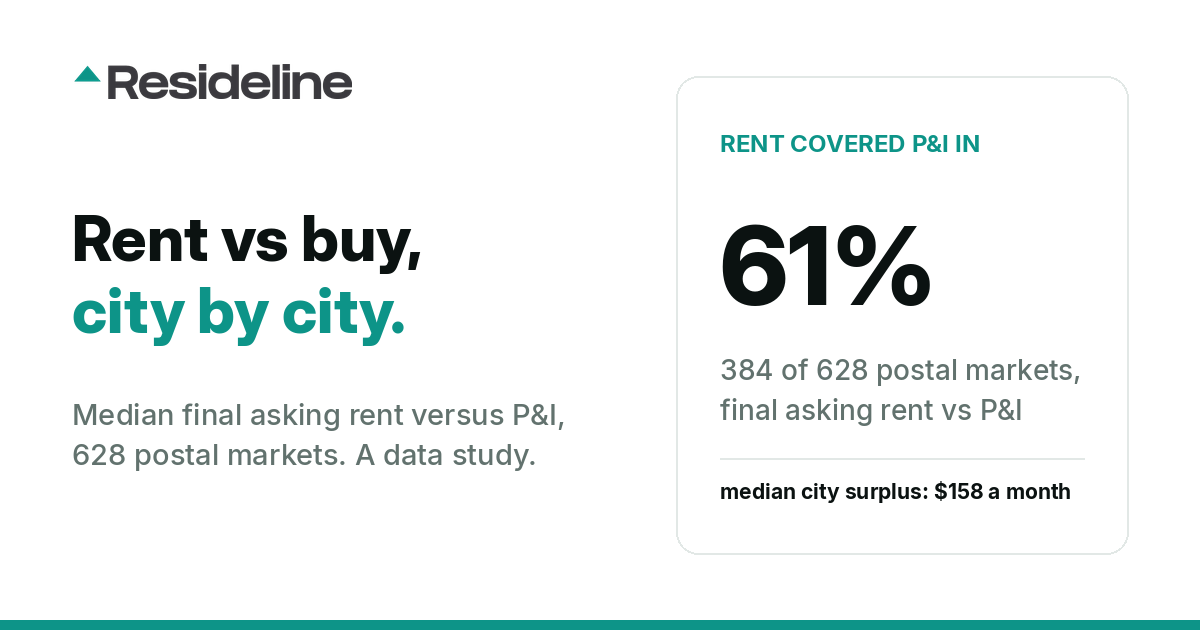
We stacked observed rents, a confirmed lease close where property records hold one and otherwise the final asking rent when a listing left the market rather than the rent it first asked, from nearly 3 million rental listings that left the market, against the mortgage payment on the median sold home in the same city. At 6.5 percent interest rate, rent covered principal and interest in 384 of 628 cities (61.1 percent). Add taxes and insurance and coverage collapsed to 23.7 percent.
How Much Will My House Be Worth in 10 Years? The 3 Percent Rule Ran Well Below the Historical Median
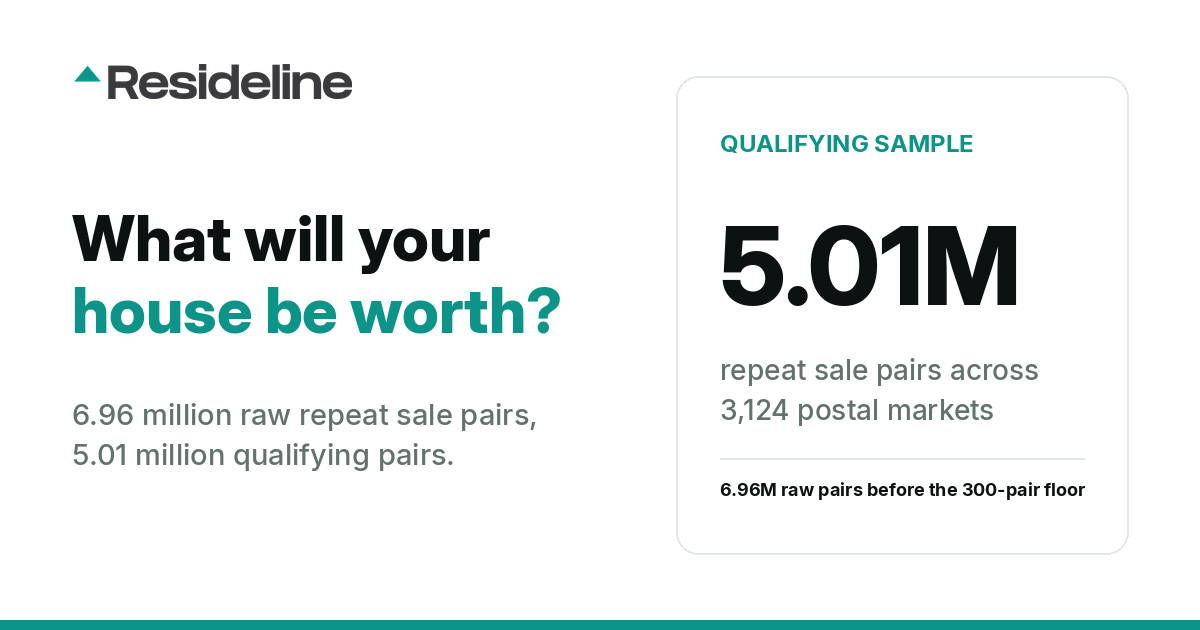
A common rule of thumb assumes roughly 3 percent a year for home appreciation. Measured against 5,014,557 repeat-sale pairs across the 3,124 qualifying US postal markets, the median market posted 5.27 percent a year in realized appreciation (the median of city medians): compounded over ten years, that is $501,142 on a $300,000 home, with the middle half of markets spanning $468,125 to $541,323, versus $403,175 at 3 percent. We matched consecutive sales of the same homes, so this is what actually happened, not a forecast.
What a Fixer-Upper Really Sells For: The 20.5% As-Is Discount, Measured in 580 Cities
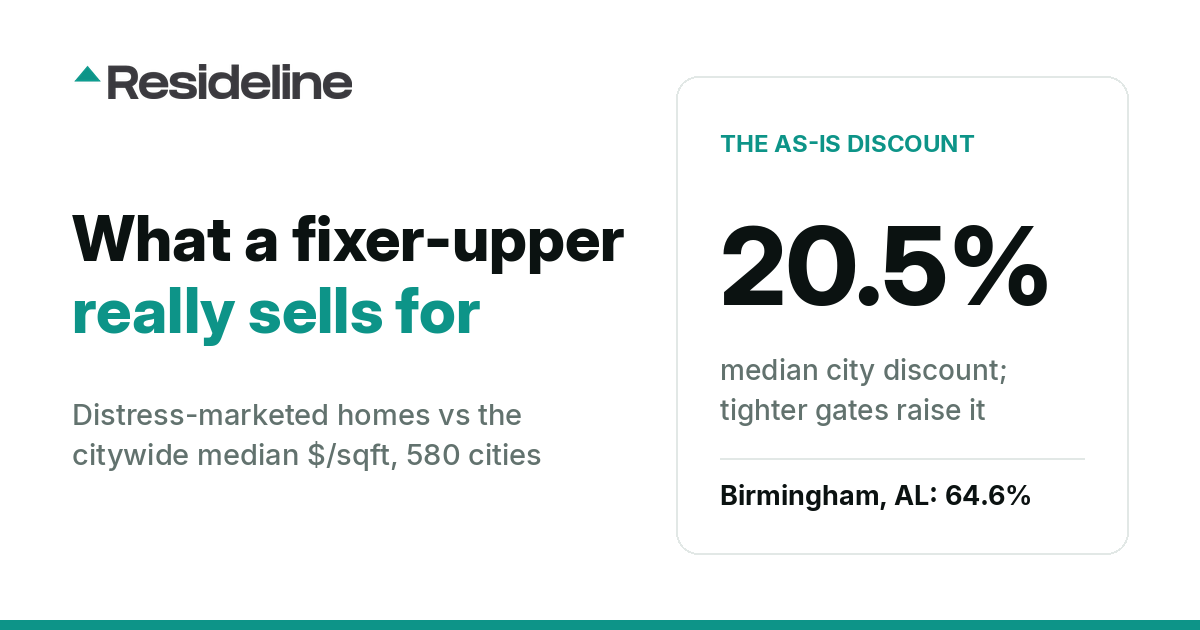
In Birmingham, AL, distress-classified homes sold at a median of $51.7 per square foot against a citywide median of $145.9. We measured that gap in the 580 U.S. cities (postal areas) with at least 50 distress-classified closed sales over 12 months: distress-marketed and poor-condition homes sold a median of 20.5 percent under the citywide median price per square foot, and tightening the sample only deepens the number.
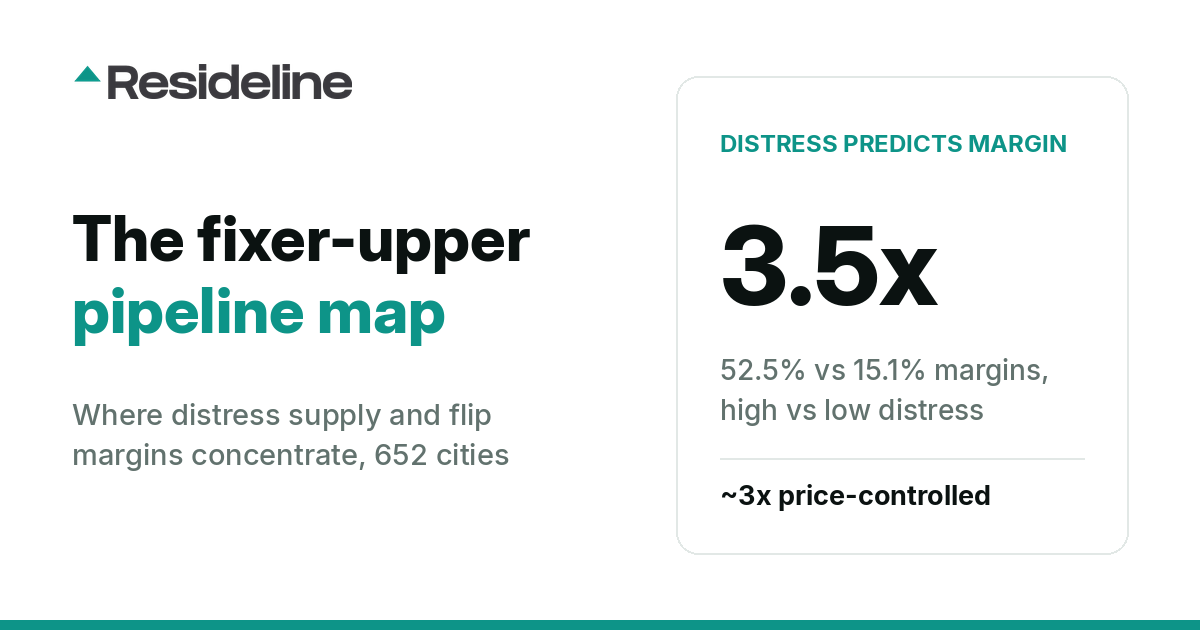
The Fixer-Upper Pipeline Map: Distress-Heavy Cities Posted 3.5x the Flip Margins
Distress supply is strongly associated with flip profit. Across 652 cities (postal areas), markets where at least 6 percent of sold-listing descriptions carried distress language posted a 52.5 percent median gross flip margin, versus 15.1 percent where distress language was rare, a 3.5x split that still runs about 3x after controlling for price. We built the map by matching 4.9 million scanned closed-sale descriptions to cities with at least 100 detected flips.
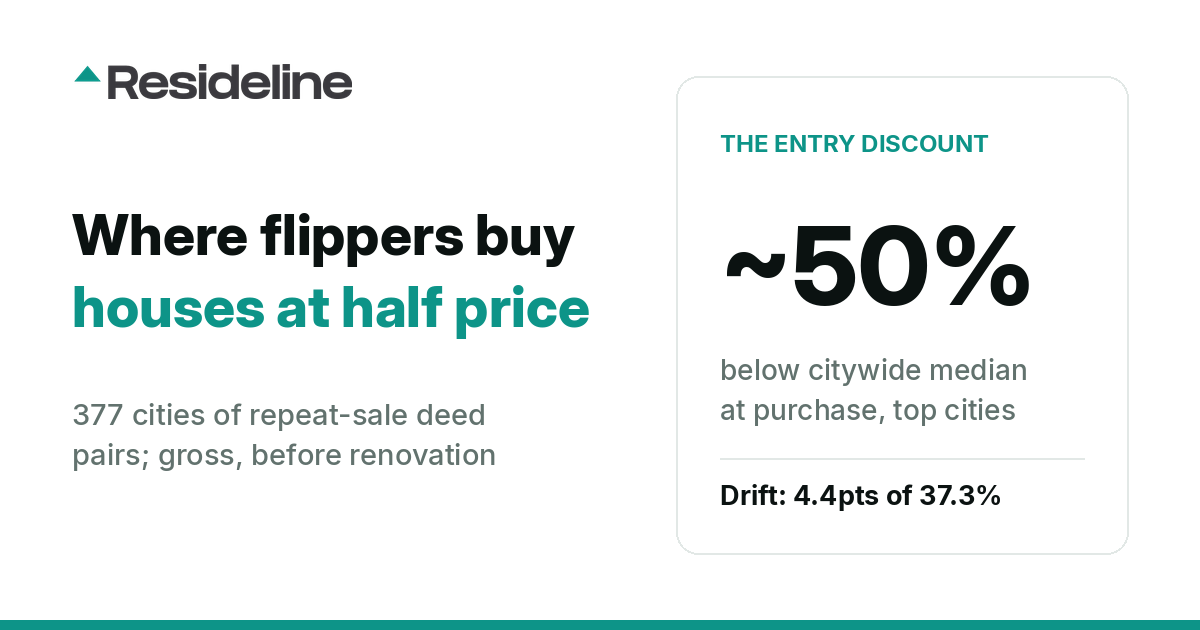
Where Flippers Buy Houses Below Market
We read the actual purchase and resale deeds for 165,054 flips across 402 postal markets. The typical flipper bought at about a quarter below the market at the time of purchase, roughly 26 percent, once we credit the market the appreciation it earned between the purchase and the recent price window. A naive comparison against today's median said about 30 percent; time-matching each purchase to its own date shaved only about 4.6 points, so the discount is realized at purchase, not handed over by a rising market. Every margin here is gross, before renovation, financing, carrying, and selling costs.
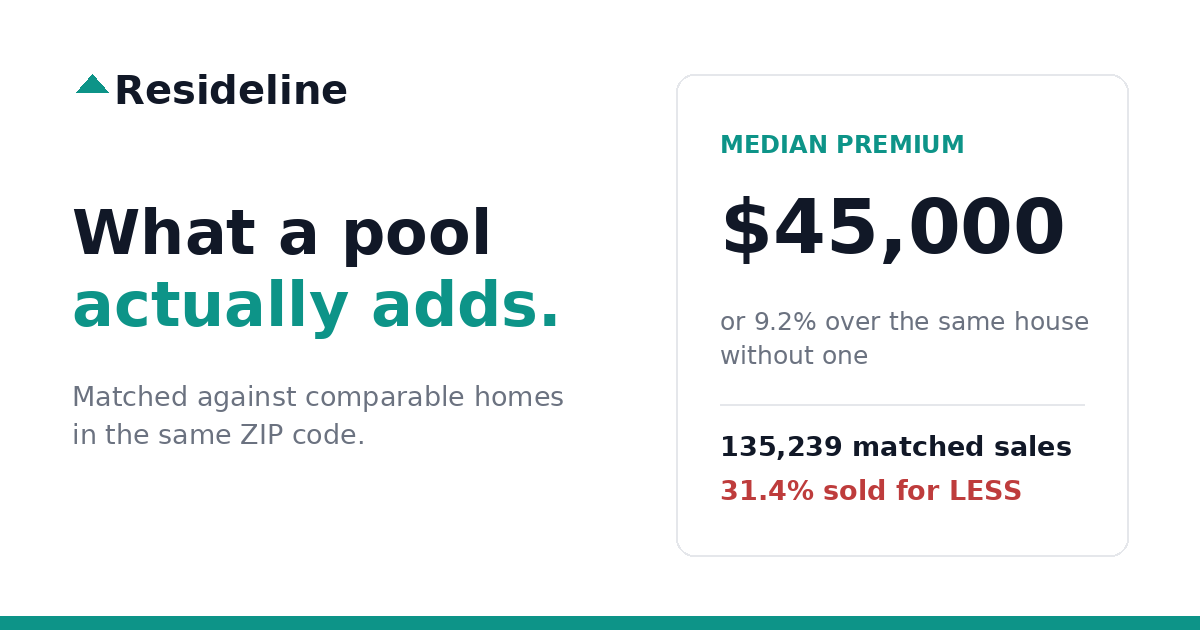
What a Swimming Pool Actually Adds: $45,000, From 135,239 Matched Sales
The most repeated number in this category, that a pool adds about 7 percent, traces to a single 1981 appraisal paper on suburban Baltimore. We measured it against closed sales instead: same ZIP code, same bedroom and bathroom count, within 10 percent on square footage. The median private pool added $45,000. In roughly one matched sale in three, it added nothing at all.
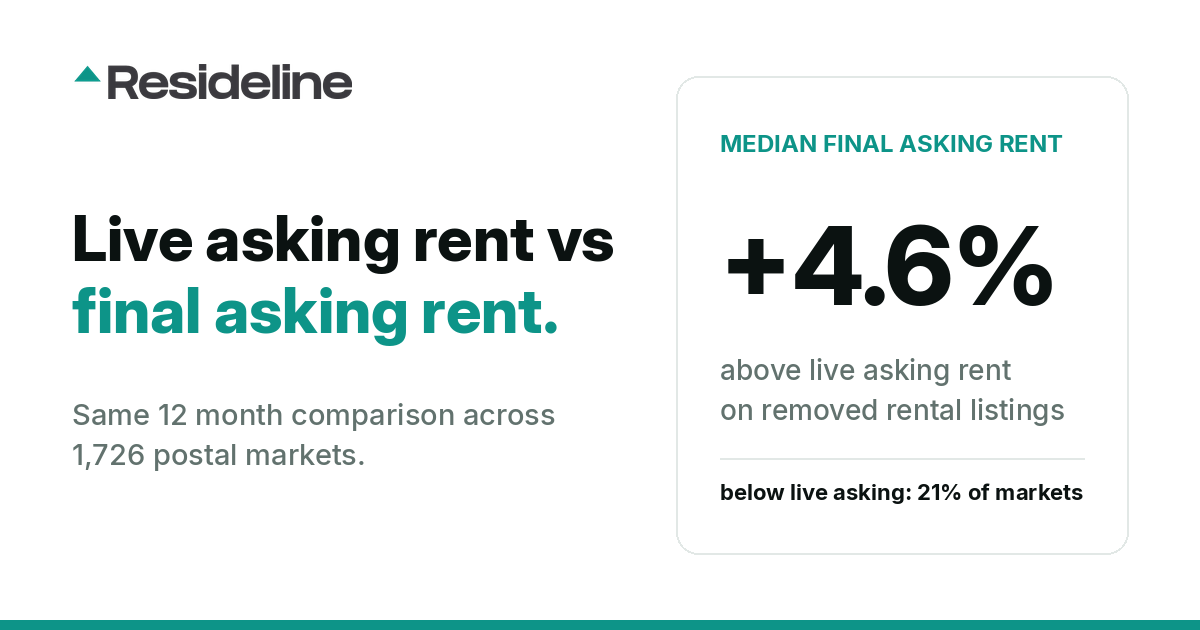
Asking Rent vs Final Asking Rent: What 12 Months of Removed Listings Show
We compared live asking rents against the final asking rent on listings that left the market, in the same 12-month window, across 1,726 US postal areas. In the median postal area the final ask runs 4.6 percent above live asking, and only 21 percent of postal areas show the final ask below live asking. An earlier edition reported the opposite; this one explains why.
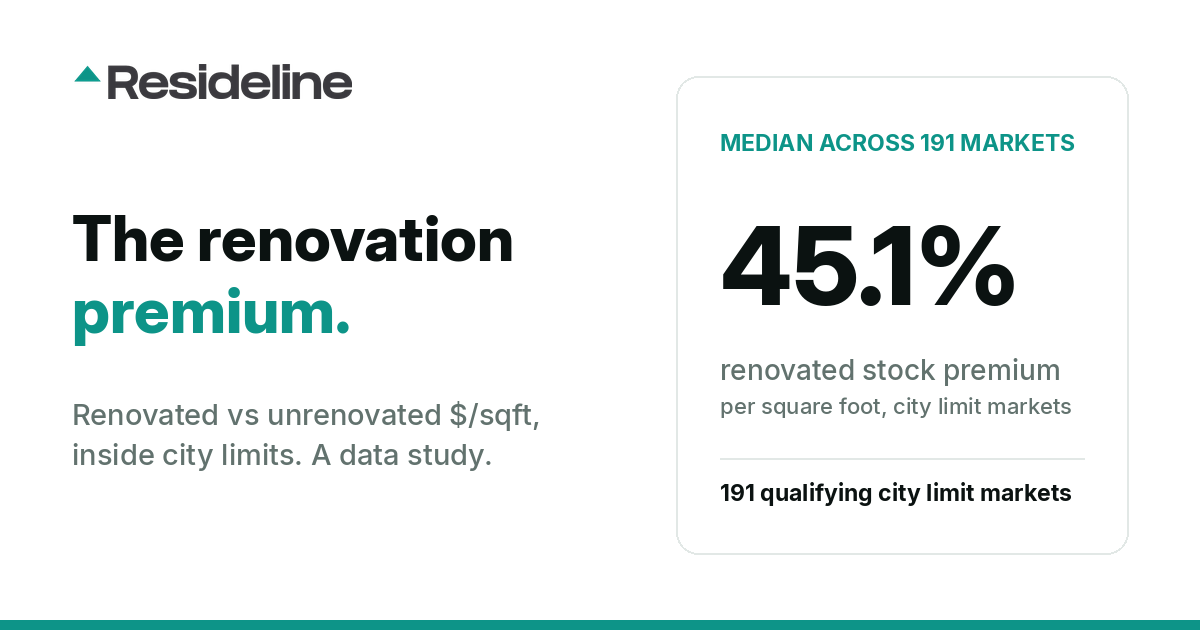
The Renovation Premium: Where Renovated Homes Command the Largest Price Gap
We measured the price gap between renovated and unrenovated homes across 1,784,956 closed sales inside the city limits of 1,674 U.S. cities. Across 191 qualifying city-limit markets, the median renovation premium is 45.1 percent; Pittsburgh leads at 264.9 percent, and the ranking changed once postal-city sampling was replaced with true municipal boundaries.
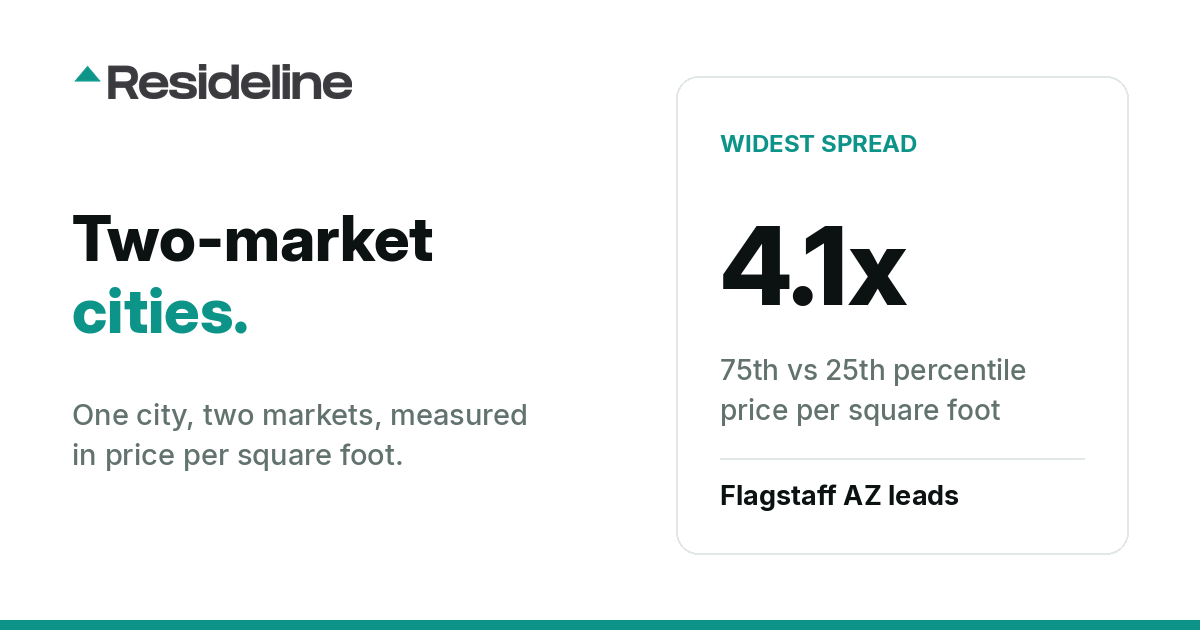
America's Two-Market Cities: Where One Median Hides Two Housing Markets
Within a single city, the 75th percentile sale can trade at three or four times the 25th percentile on price per square foot. We ranked 1,039 US postal areas by this spread ratio and found two very different causes, luxury geography and condition bimodality.
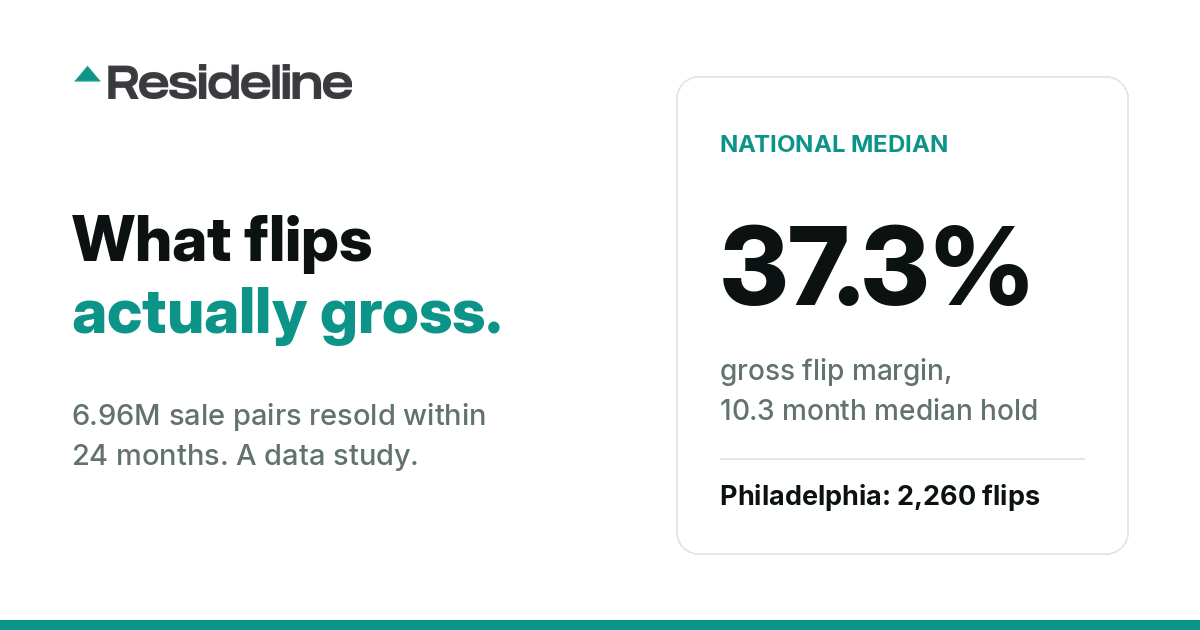
Where Flips Actually Happen and What They Gross: House Flipping Margins by City
From 6.96 million sale pairs we isolated the flip signature, properties resold within 3 to 24 months at a higher price, and ranked US metros by flip volume and gross margin. The national median gross margin is 37.3 percent on a 10.3 month hold, and the spread between cities is enormous.
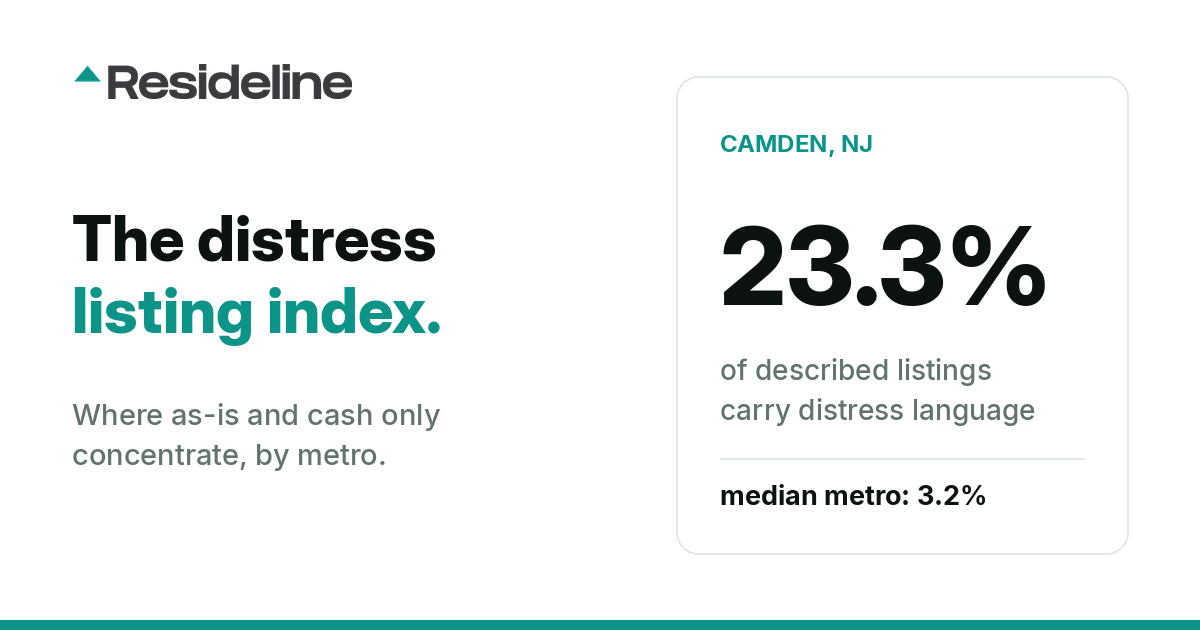
The Distress Language Index: Where As-Is and Investor Special Listings Concentrate
We scanned 4.9 million closed-sale listing descriptions for the phrases agents actually write, as-is, cash only, investor special, fixer, and ranked the metros where distress language concentrates. The median metro share is 3.21 percent. Camden, NJ hits 23.27 percent.
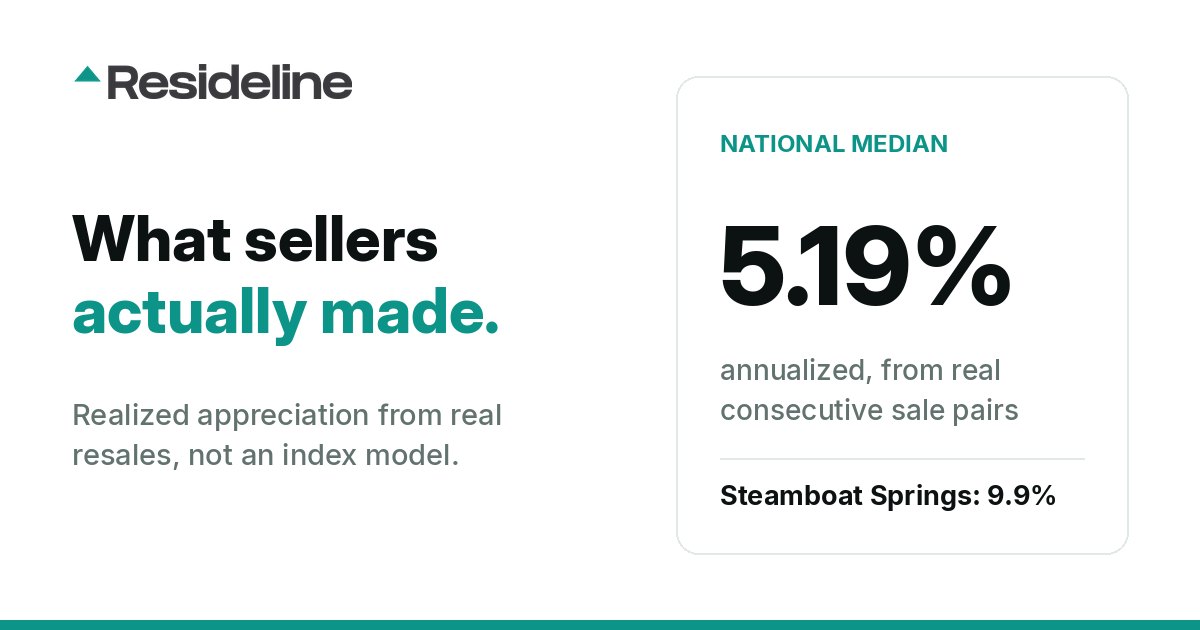
What Sellers Actually Made: Real Home Appreciation by City, From 6.96 Million Repeat Sales
Index-based appreciation is modeled. We measured what sellers actually made, using 6,963,756 pairs of consecutive sales of the same home. The national median is 5.19 percent a year, and the gap between the best and worst metros is 8.42 points, every year.
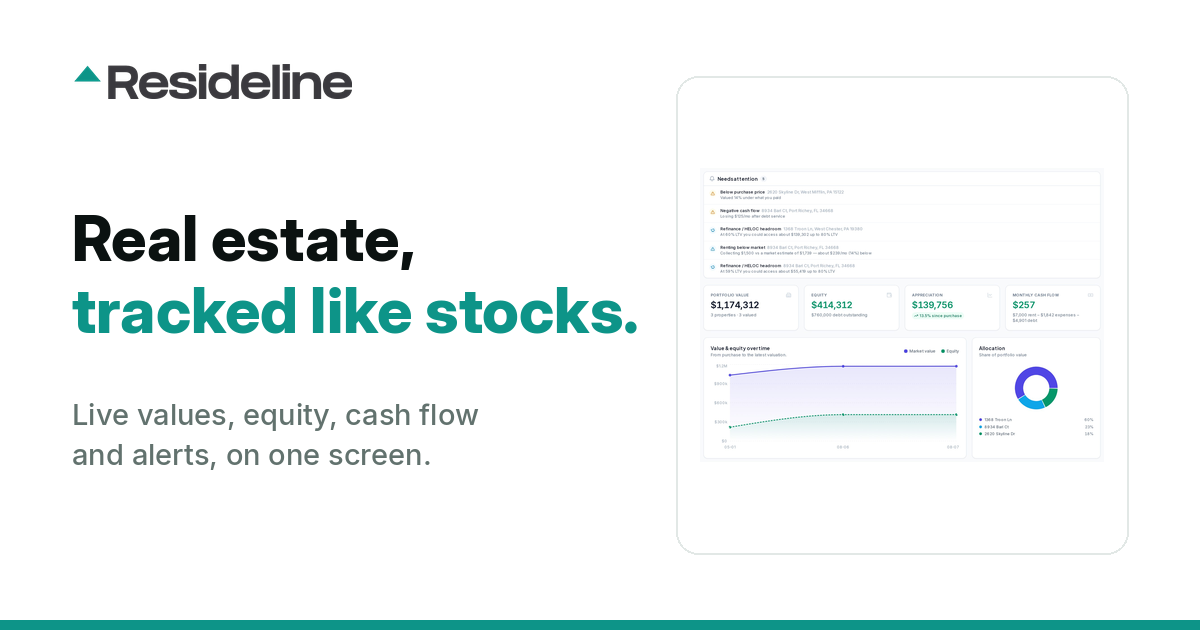
Track Your Real Estate Portfolio Like a Stock Portfolio
Your brokerage app prices every position live. Your rental portfolio lives in a spreadsheet from three months ago. We built Portfolio to close that gap: every property you own, valued automatically as the market moves, with alerts for what needs attention.
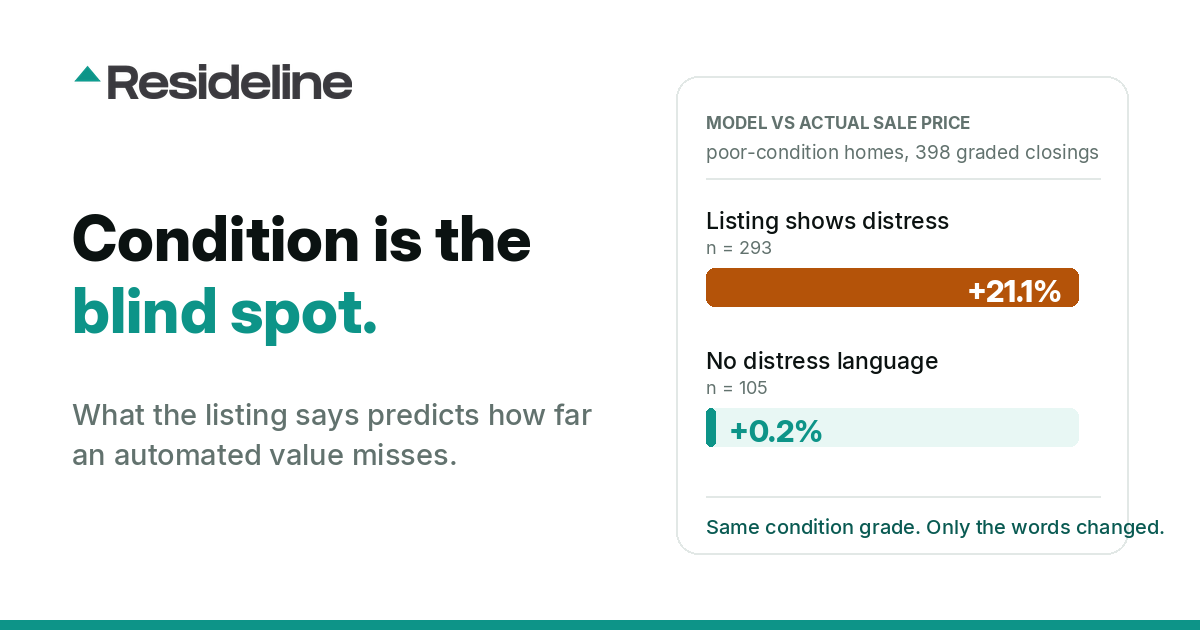
Condition Is the Blind Spot in Automated Home Valuations
Redfin asked us what appraisers look for. The answer, condition, is also what automated valuations miss most: on distressed listings our model ran 21% above the real sale price, while identical homes without distress language were unbiased.

How Accurate Are Online Home Value Estimates?
Online home value estimates are good enough to browse with and rarely good enough to transact on. What drives the error, why published accuracy figures flatter the model, and how to check one.

Why Do Zillow and Redfin Show Different Home Values?
Two home value estimates can sit ten percent apart and both be defensible. Here is exactly why AVMs disagree on the same house, and what the size of the spread is telling you about the property.

What Is an AVM (Automated Valuation Model)?
An AVM estimates what a property is worth from data alone, with no site visit. How AVMs work step by step, the main model families, how they differ from an appraisal, and where they break.

Why Online Home Value Estimates Get It Wrong
Estimates miss for a short list of repeatable reasons: invisible condition, thin comp density, non-disclosure states, submarket boundaries, stale records, and homes that are unusual for their area.

How to Check Whether a Home Value Estimate Is Accurate
You audit an estimate by opening its comparable sales, not by comparing it to a second estimate. A six step check on any individual number, plus the four questions any accuracy claim must answer.

What AVM Accuracy Actually Means for Investors
A headline median error rate is close to useless for an investor, because you do not buy the median house. What matters is error inside your buy box, the direction of the bias, and a frozen tape.

Median Error Rate: How to Read an AVM's Accuracy Claim
A median error rate is the middle of all the percentage misses a model made. Here is what it measures, what it hides, and the four questions that separate a real accuracy claim from marketing.

Why Home Value Estimates Break on Fixer-Uppers
Condition is not a field in public property data, so automated estimates systematically over-value fixer-uppers. Why the error runs one direction, why the comp pool makes it worse, and what to do.

What Is ARV in Real Estate? (After Repair Value Explained)
ARV, or After Repair Value, is what a property will be worth once renovations are complete. Here is how investors calculate it from comps, a worked example, and the mistakes that cost real money.

As-Is Value vs ARV: What's the Difference?
As-is value is what a property is worth today. ARV is what it is worth after the rehab. The gap between them is not your repair budget, and confusing the two is how flips lose money on paper.

What Is the 70% Rule in House Flipping?
The 70% rule caps a flipper's offer at 70 percent of ARV minus repairs. Here is the formula, what the 30 percent actually pays for, and when the multiplier should change.

Maximum Allowable Offer (MAO): The Formula Investors Use
Maximum Allowable Offer is the highest price you can pay and still hit your profit target. Here is the MAO formula, an itemized version, and the three inputs that wreck it.

How Real Estate Comps Are Chosen (And Why Bad Ones Ruin Valuations)
Comps are chosen on location, type, size, age, and condition, then adjusted for what is left. Here is the selection order appraisers use and how bad comps quietly wreck a valuation.

Cap Rate vs Cash-on-Cash Return: Which Should You Use?
Cap rate measures the asset, cash-on-cash measures your position in it. Here is the difference, a worked example showing both, and how to spot negative leverage before you buy.

What Is the BRRRR Method? A Step-by-Step Breakdown
BRRRR means Buy, Rehab, Rent, Refinance, Repeat. Here is each step, a full worked example with the refinance math, and what happens when the appraisal comes in low.

What Is a DSCR Loan? Qualifying on Rent, Not Income
A DSCR loan qualifies the property, not your income: rent has to cover the payment. Here is how DSCR is calculated, how to fix a low ratio, and what the ratio does not tell you.

What Is a 1031 Exchange? Rules, Timeline, and Limits
A 1031 exchange lets an investor sell an investment property and reinvest the proceeds into another one without paying capital gains tax that year. Here are the rules, deadlines, and limits.

The 1031 Exchange 45-Day and 180-Day Rules Explained
You have 45 days to identify replacement property and 180 days to close. Both clocks start the day after your sale closes and run at the same time. Here is exactly how they work.

What Is Boot in a 1031 Exchange? (And How to Avoid It)
Boot is any value you receive in a 1031 exchange that is not like-kind property, usually cash or debt relief. It is taxable up to your realized gain. Here is how it happens and how to avoid it.

What Is a Good Cash-on-Cash Return on Rental Property?
Most rental investors target a cash-on-cash return of roughly 8 to 12 percent, but the honest answer depends on your financing, your market, and what else you could do with the money.

How to Calculate Rental Property Cash Flow
Rental cash flow is rent collected minus every operating expense minus debt service. The formula is simple, but the expense list is where most investors get it wrong. Here is the full method.

What Is the 1% Rule in Real Estate Investing?
The 1% rule says a rental should bring in monthly rent equal to at least 1% of its purchase price. It is a fast screening filter, not an analysis, and here is exactly where it breaks.

Appraisal vs AVM: When You Need a Human and When You Don't
An appraisal is a licensed human inspecting the property and defending a value in writing. An AVM is a statistical model producing an instant estimate. Here is when each one is the right tool.

What Is a CMA Report in Real Estate?
A CMA report is a comparative market analysis, an estimate of what a property should sell for based on recent sales of similar nearby homes. Here is what goes into one and how to read it.

What Does It Really Cost to Flip a House?
Purchase price and rehab are only about two thirds of the story. Acquisition, financing, holding, and selling costs routinely add 15 percent of the after-repair value. Here is the full breakdown.
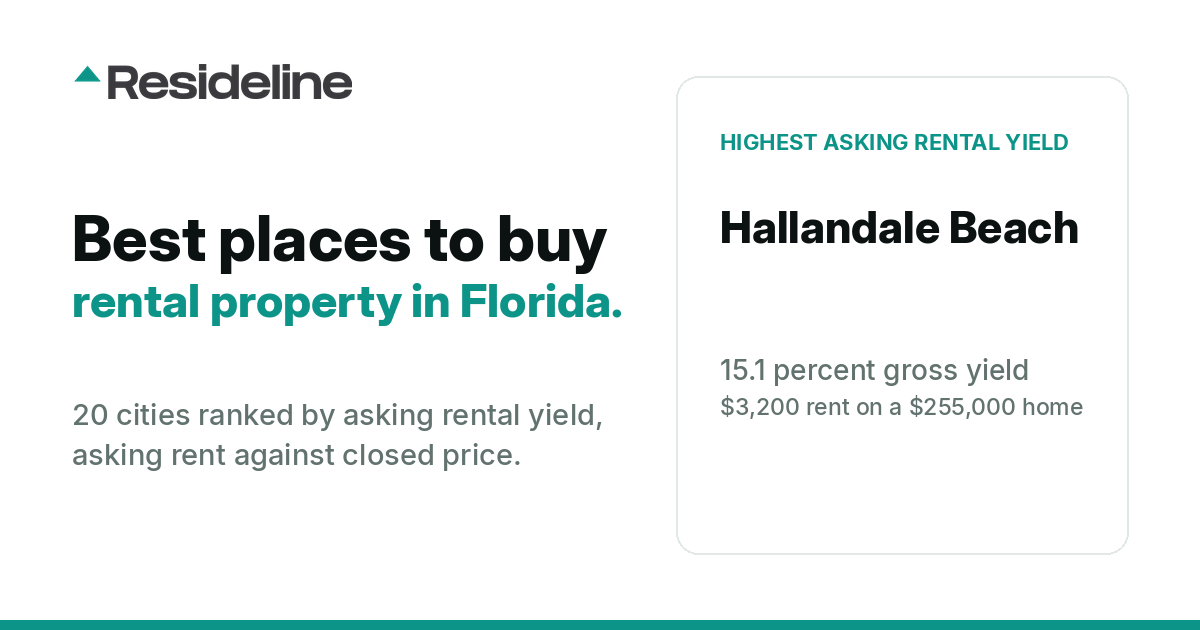
Best Places to Buy Rental Property in Florida (2026)
Twenty Florida cities ranked by asking rental yield, from 15.1 percent in Hallandale Beach to 9.1 percent in Lake City, using tracked home sales and rental listings; geographic coverage explained below.
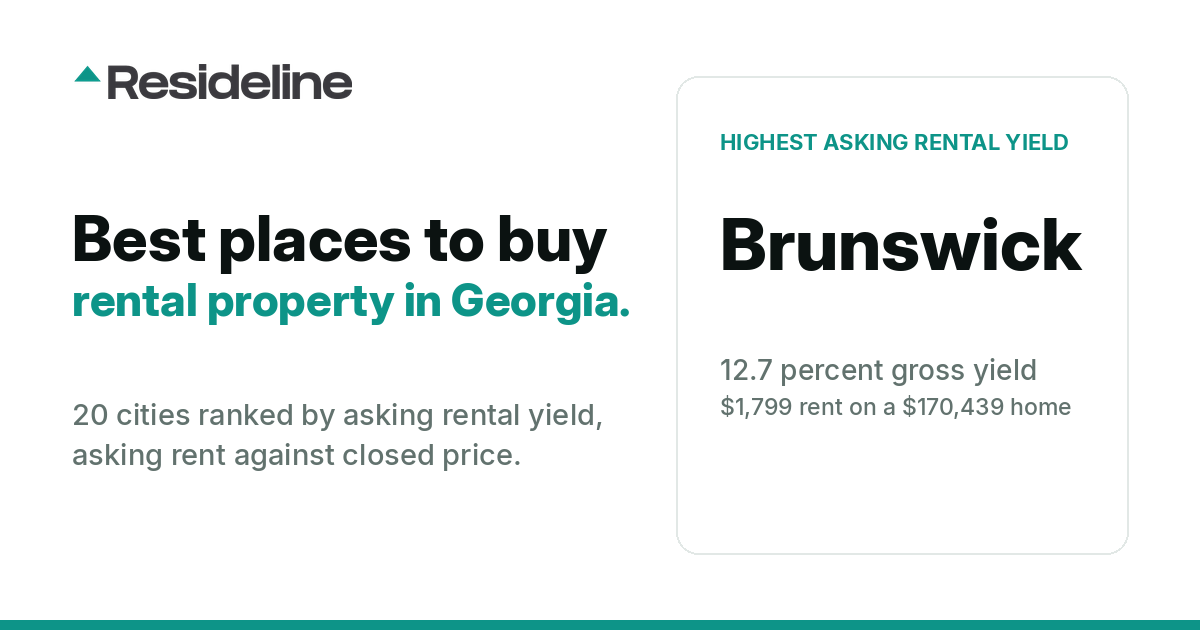
Best Places to Buy Rental Property in Georgia (2026)
Twenty Georgia cities ranked by asking rental yield, from 12.7 percent in Brunswick to 8.0 percent in Perry, using tracked home sales and rental listings; geographic coverage explained below.
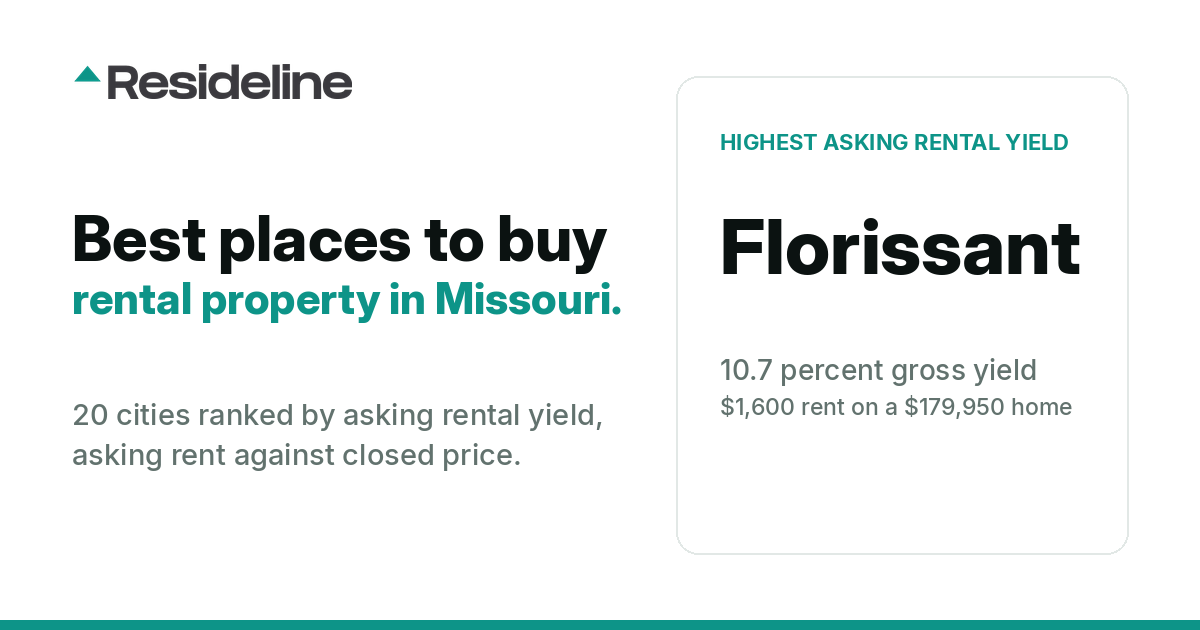
Best Places to Buy Rental Property in Missouri (2026)
Twenty Missouri cities ranked by asking rental yield, from 10.7 percent in Florissant to 6.7 percent in Republic, using tracked home sales and rental listings; geographic coverage explained below.
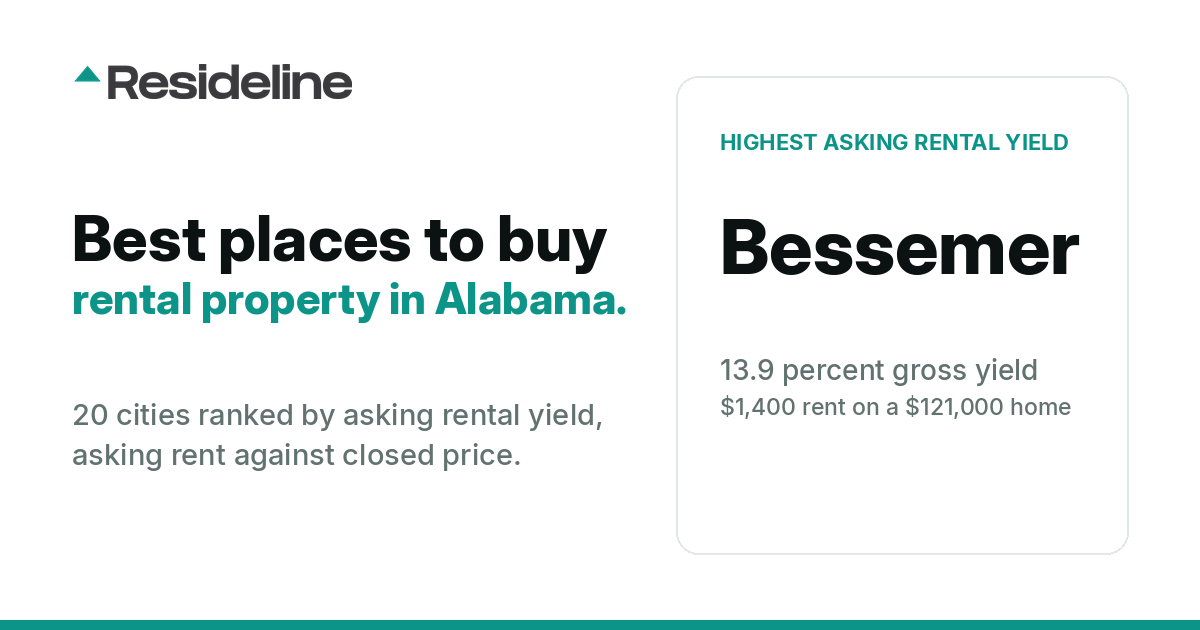
Best Places to Buy Rental Property in Alabama (2026)
Twenty Alabama cities ranked by asking rental yield, from 13.9 percent in Bessemer to 6.7 percent in Tuscaloosa, using tracked home sales and rental listings; geographic coverage explained below.
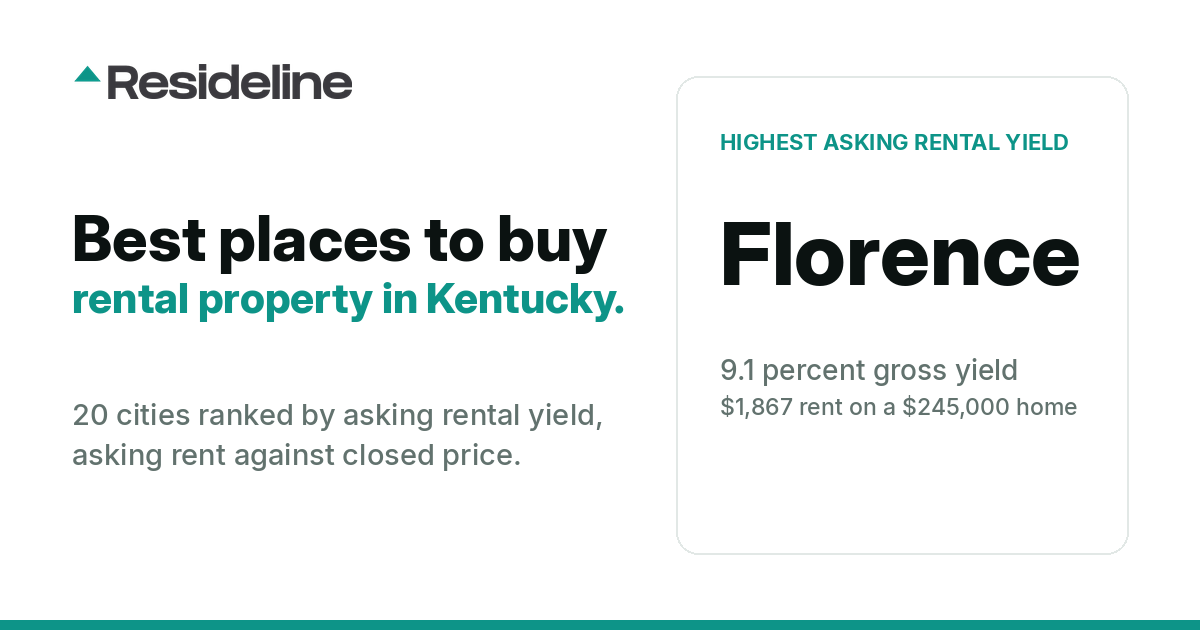
Best Places to Buy Rental Property in Kentucky (2026)
Twenty Kentucky cities ranked by asking rental yield, from 9.1 percent in Florence to 5.6 percent in Hopkinsville, using tracked home sales and rental listings; geographic coverage explained below.
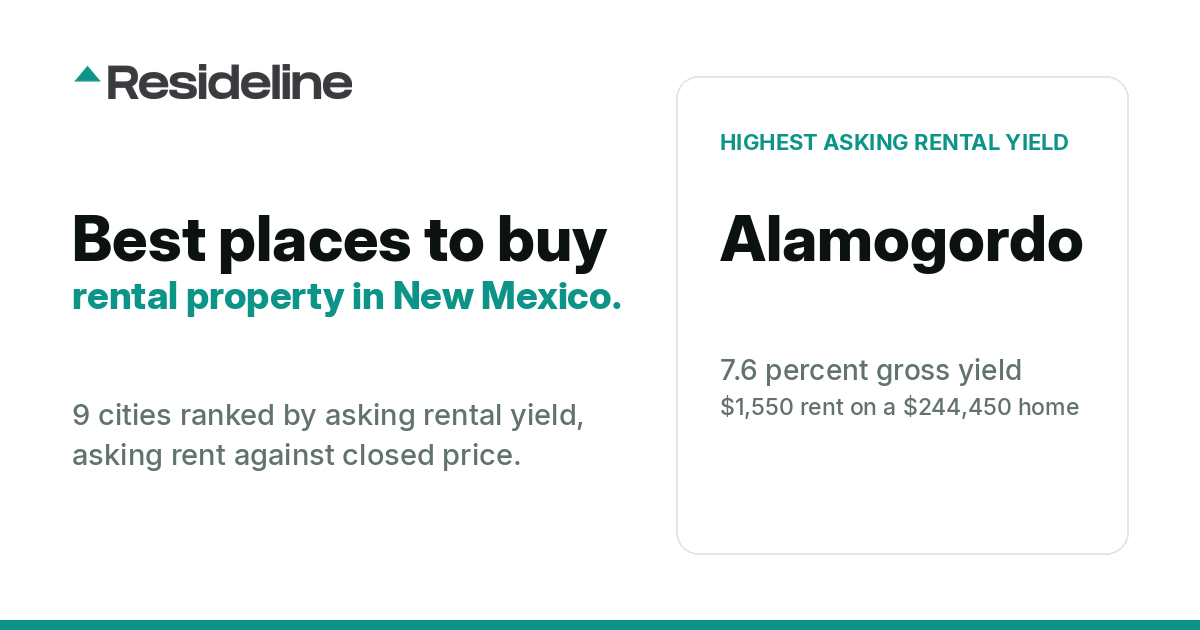
Best Places to Buy Rental Property in New Mexico (2026)
Nine New Mexico cities ranked by asking rental yield, from 7.6 percent in Alamogordo to 5.5 percent in Santa Fe, using tracked home sales and rental listings; geographic coverage explained below.
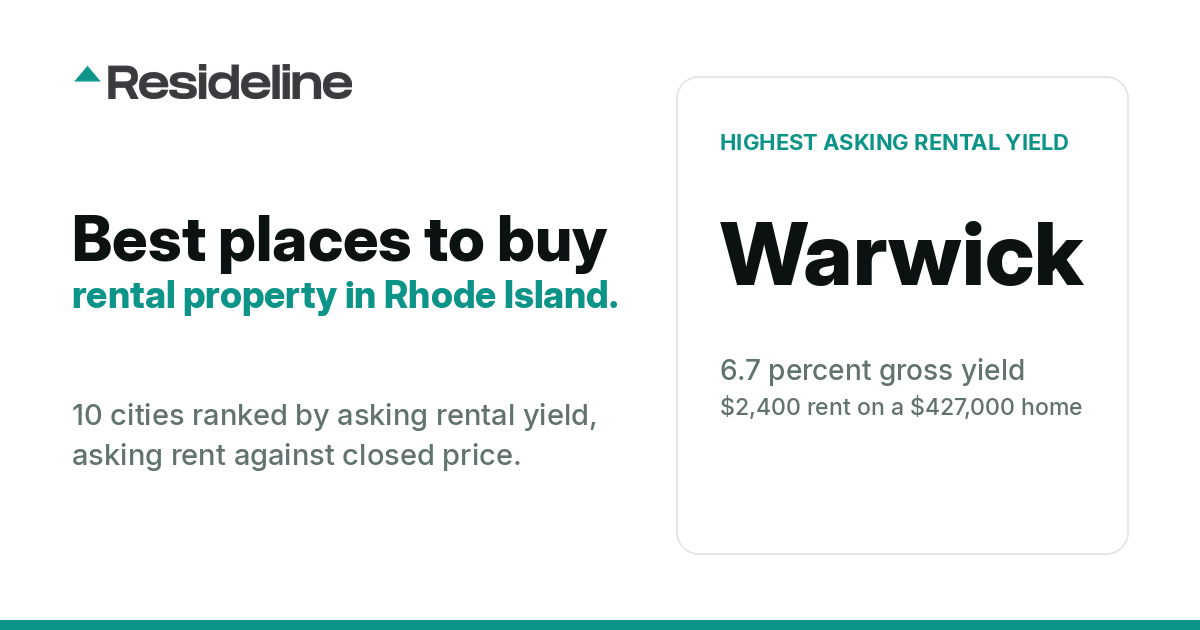
Best Places to Buy Rental Property in Rhode Island (2026)
Ten Rhode Island cities ranked by asking rental yield, from 6.7 percent in Warwick to 4.6 percent in Cumberland, using tracked home sales and rental listings; geographic coverage explained below.
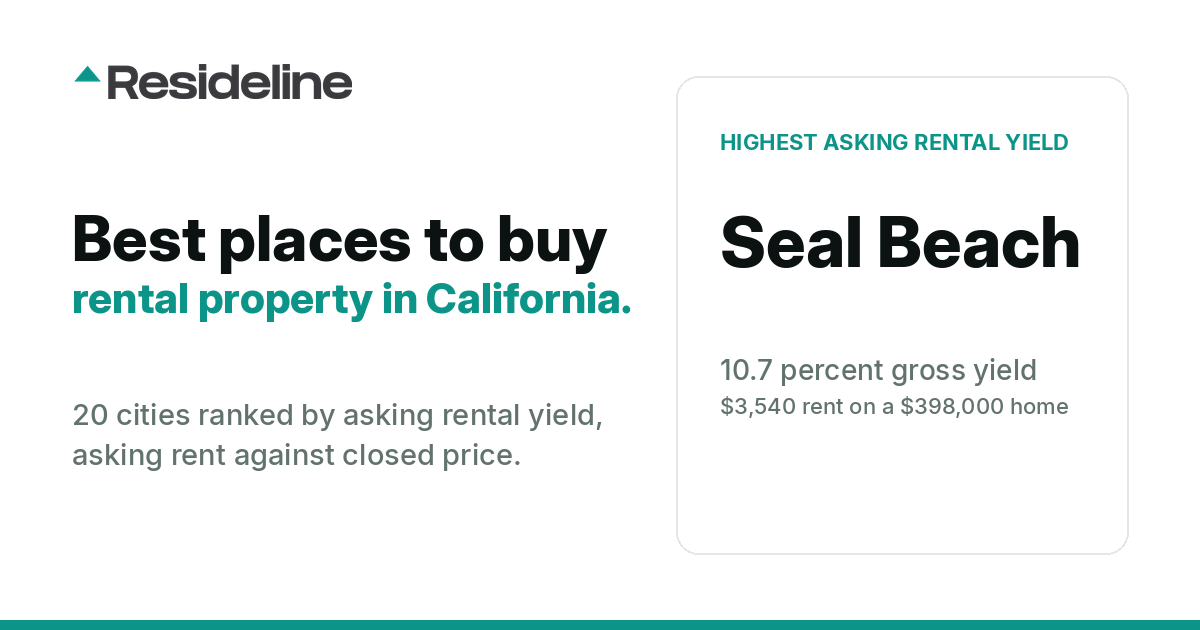
Best Places to Buy Rental Property in California (2026)
Twenty California cities ranked by asking rental yield, from 10.7 percent in Seal Beach to 6.5 percent in Yucca Valley, using tracked home sales and rental listings; geographic coverage explained below.
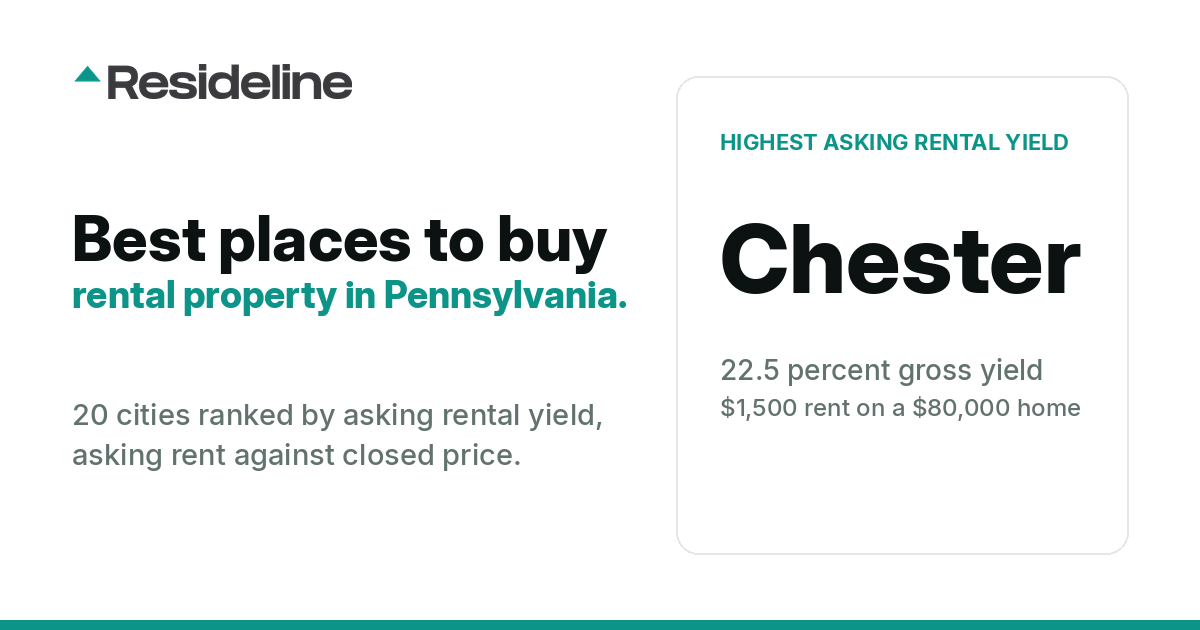
Best Places to Buy Rental Property in Pennsylvania (2026)
Twenty Pennsylvania cities ranked by asking rental yield, from 22.5 percent in Chester to 8.6 percent in Carlisle, using tracked home sales and rental listings; geographic coverage explained below.
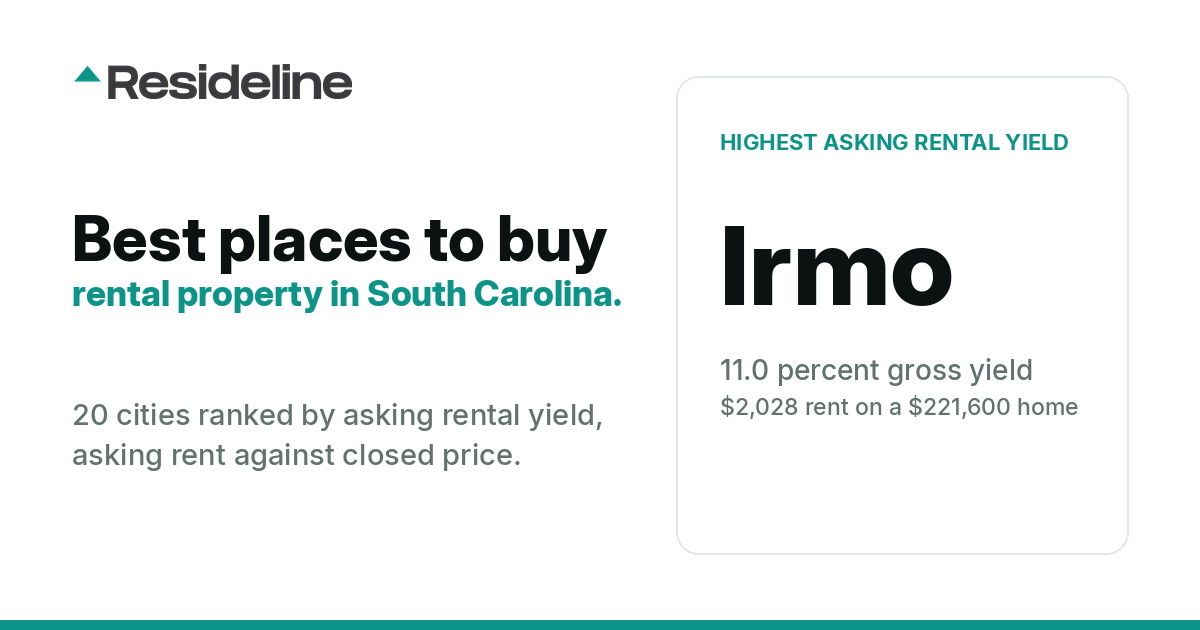
Best Places to Buy Rental Property in South Carolina (2026)
Twenty South Carolina cities ranked by asking rental yield, from 11.0 percent in Irmo to 7.3 percent in Little River, using tracked home sales and rental listings; geographic coverage explained below.
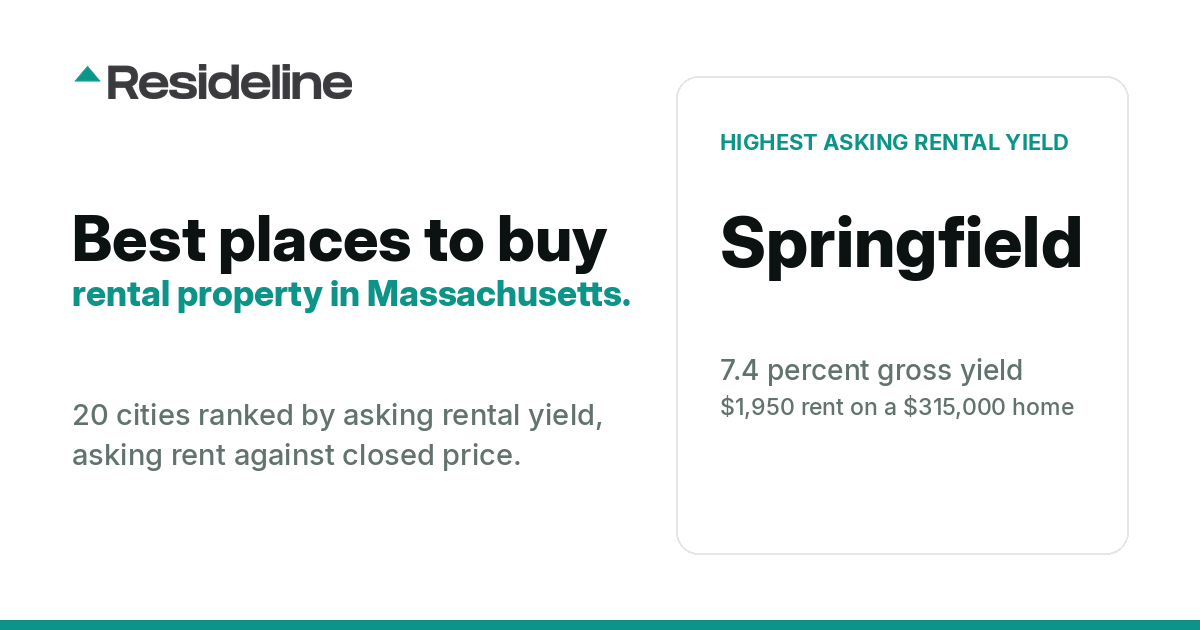
Best Places to Buy Rental Property in Massachusetts (2026)
Twenty Massachusetts cities ranked by asking rental yield, from 7.4 percent in Springfield to 4.7 percent in Attleboro, using tracked home sales and rental listings; geographic coverage explained below.
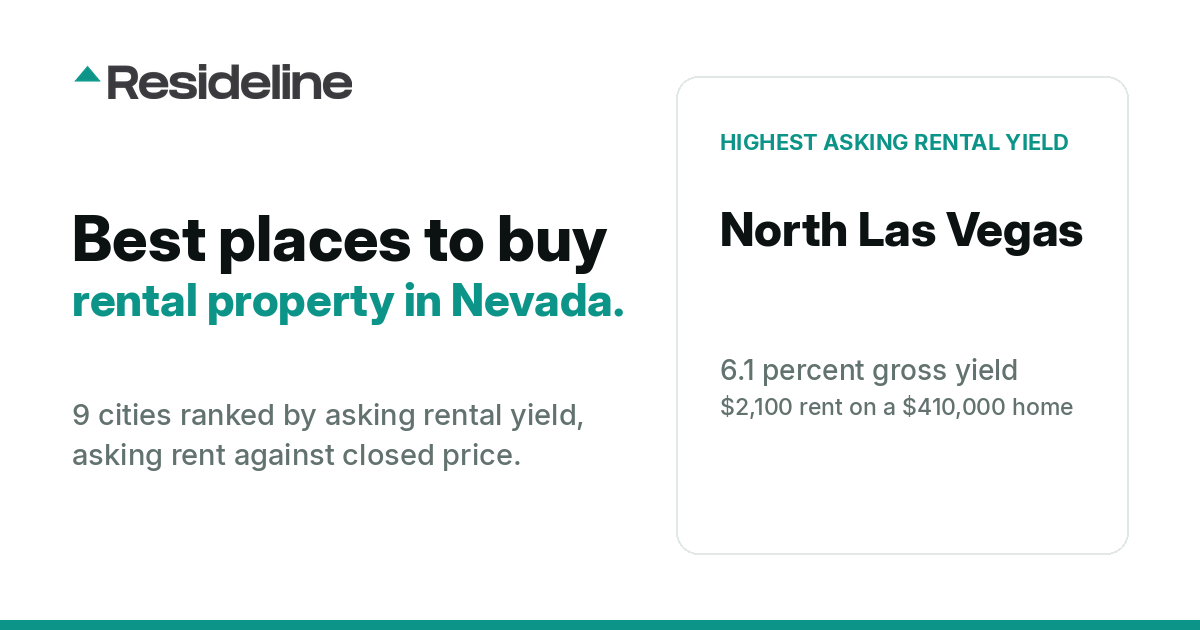
Best Places to Buy Rental Property in Nevada (2026)
Nine Nevada cities ranked by asking rental yield, from 6.1 percent in North Las Vegas to 4.7 percent in Reno, using tracked home sales and rental listings; geographic coverage explained below.
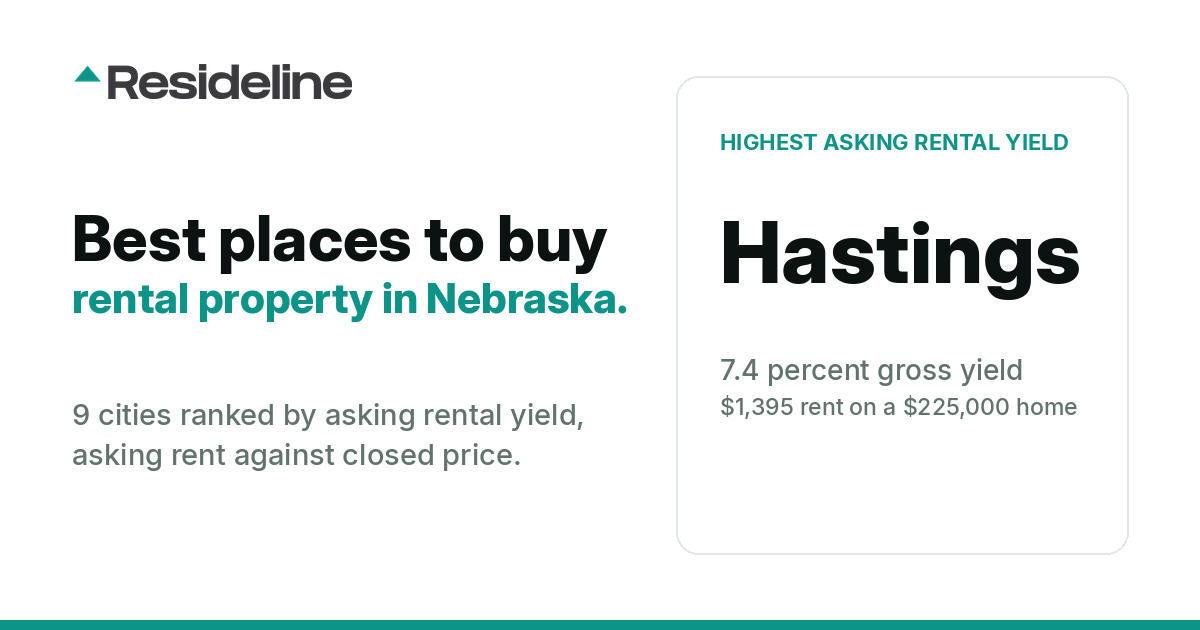
Best Places to Buy Rental Property in Nebraska (2026)
Nine Nebraska cities ranked by asking rental yield, from 7.4 percent in Hastings to 4.7 percent in Lincoln, using tracked home sales and rental listings; geographic coverage explained below.
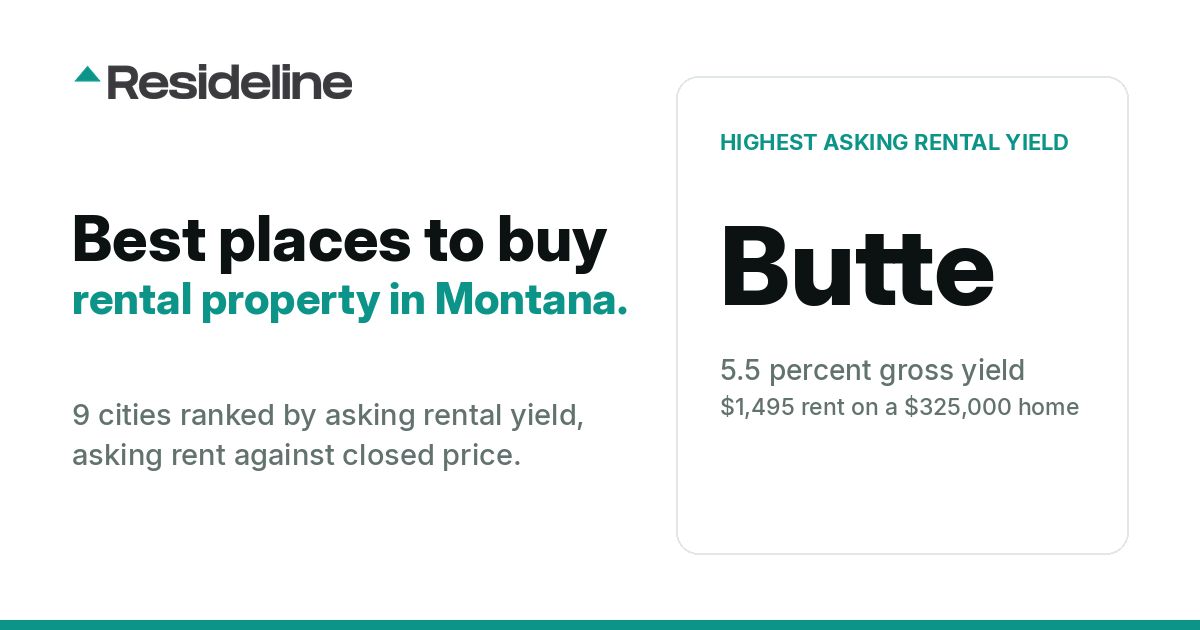
Best Places to Buy Rental Property in Montana (2026)
Nine Montana cities ranked by asking rental yield, from 5.5 percent in Butte to 3.1 percent in Whitefish, using tracked home sales and rental listings; geographic coverage explained below.
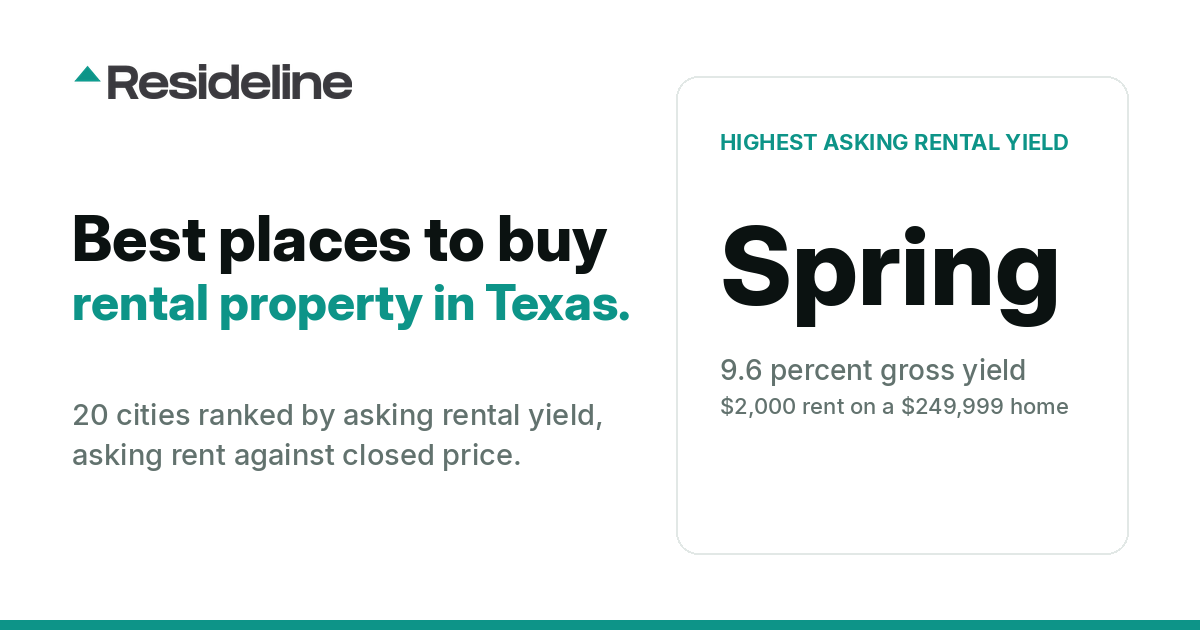
Best Places to Buy Rental Property in Texas (2026)
Twenty Texas cities ranked by asking rental yield, from 9.6 percent in Spring to 7.9 percent in Crandall, using tracked home sales and rental listings; geographic coverage explained below.
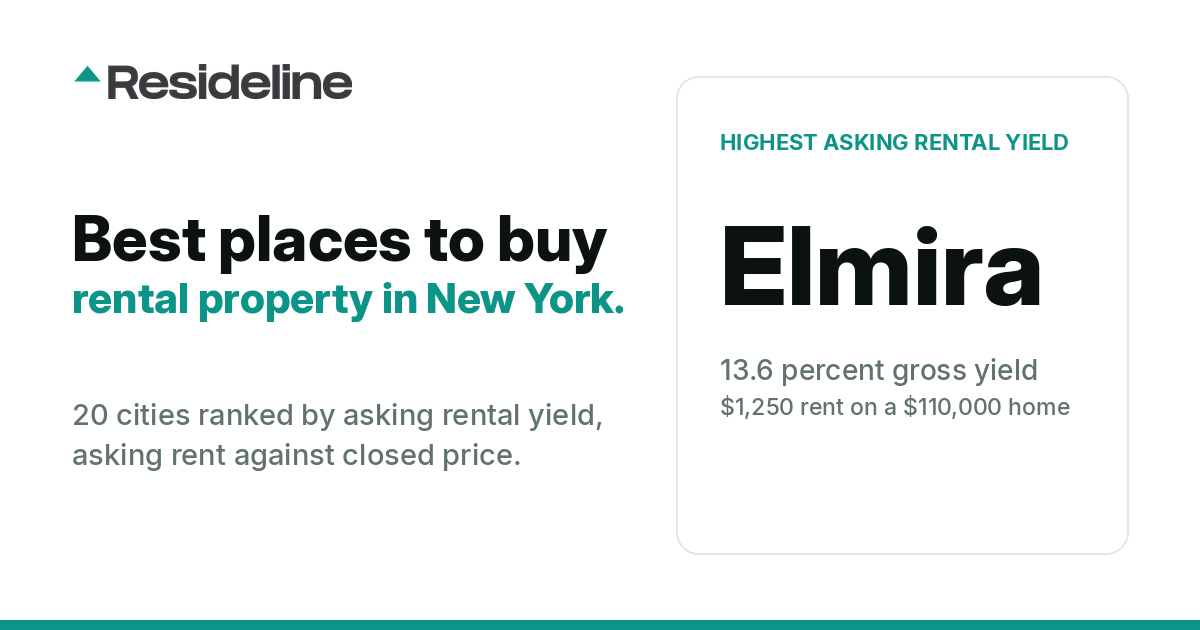
Best Places to Buy Rental Property in New York (2026)
Twenty New York cities ranked by asking rental yield, from 13.6 percent in Elmira to 6.7 percent in Cheektowaga, using tracked home sales and rental listings; geographic coverage explained below.
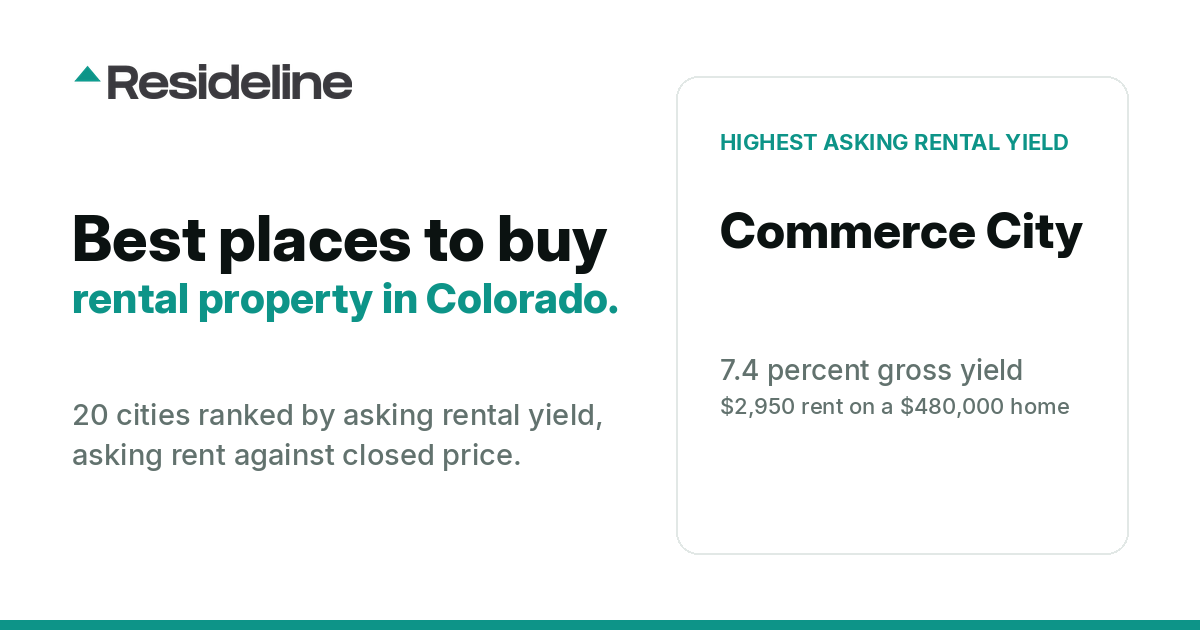
Best Places to Buy Rental Property in Colorado (2026)
Twenty Colorado cities ranked by asking rental yield, from 7.4 percent in Commerce City to 5.4 percent in Windsor, using tracked home sales and rental listings; geographic coverage explained below.
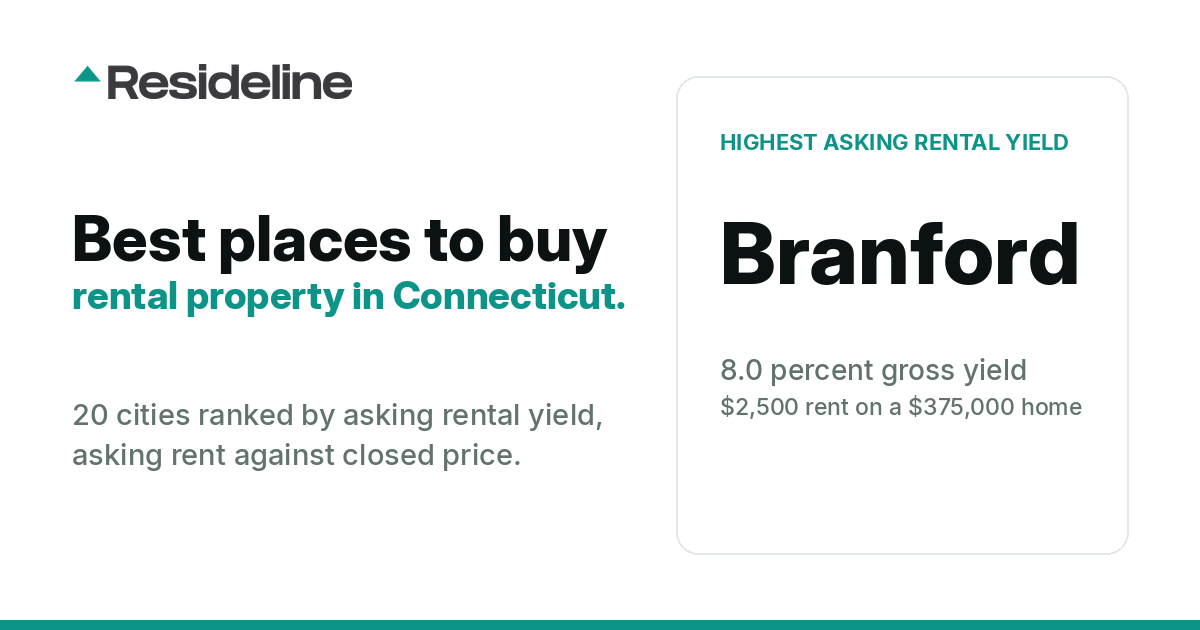
Best Places to Buy Rental Property in Connecticut (2026)
Twenty Connecticut cities ranked by asking rental yield, from 8.0 percent in Branford to 6.3 percent in Wallingford, using tracked home sales and rental listings; geographic coverage explained below.
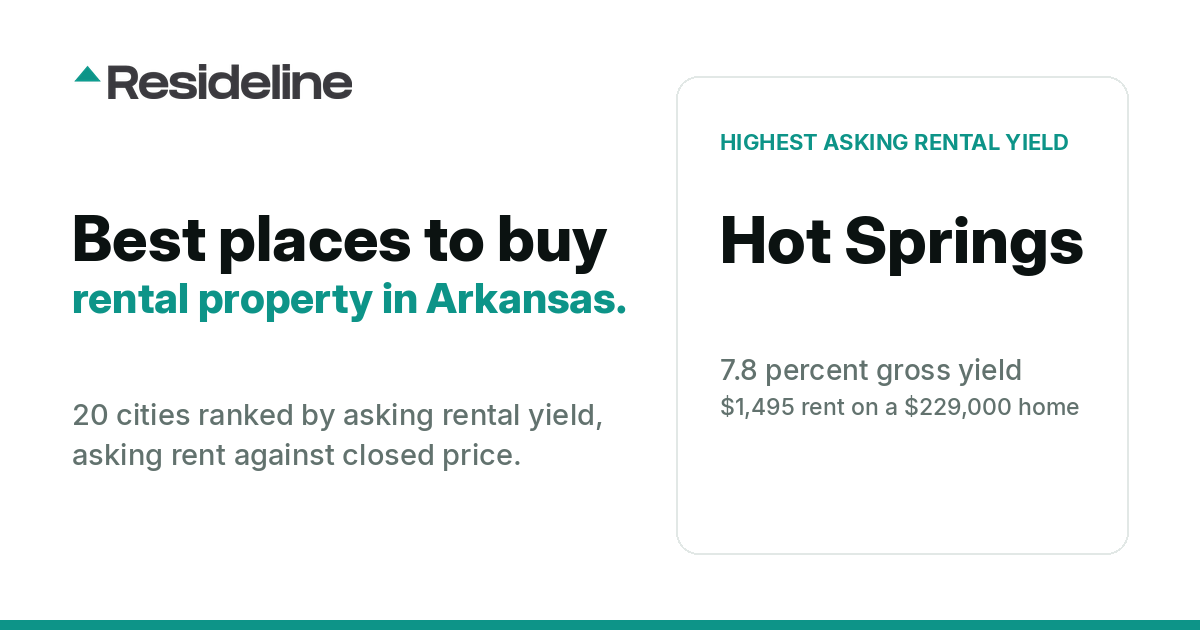
Best Places to Buy Rental Property in Arkansas (2026)
Twenty Arkansas cities ranked by asking rental yield, from 7.8 percent in Hot Springs to 5.4 percent in Fayetteville, using tracked home sales and rental listings; geographic coverage explained below.
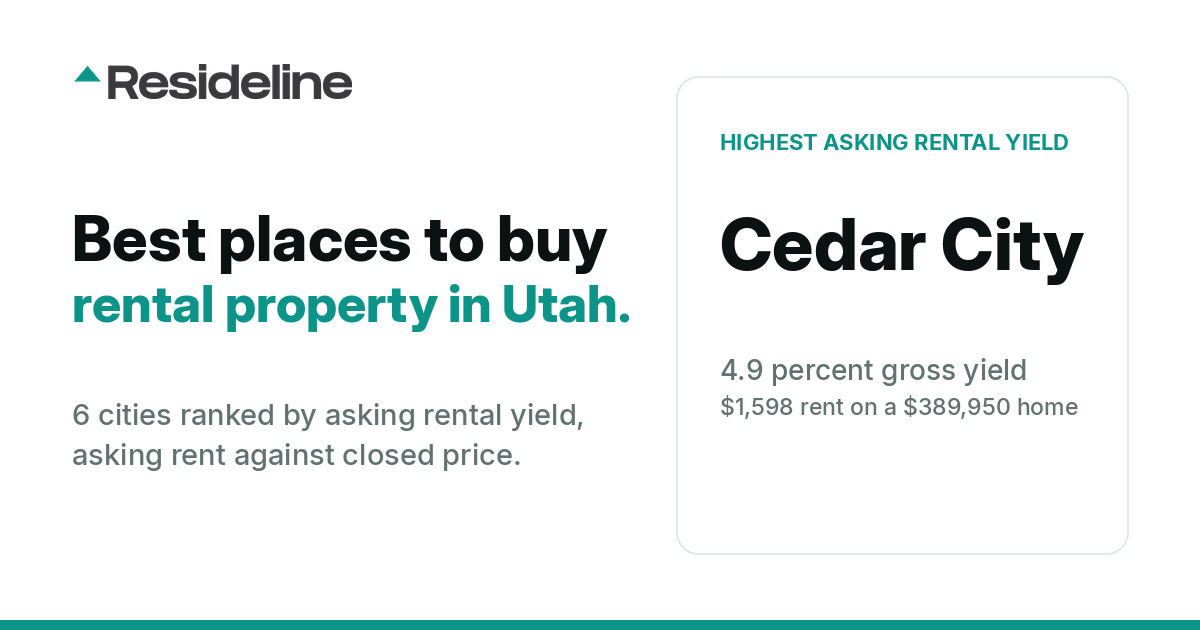
Best Places to Buy Rental Property in Utah (2026)
Six Utah cities ranked by asking rental yield, from 4.9 percent in Cedar City to 3.4 percent in Salt Lake City, using tracked home sales and rental listings; geographic coverage explained below.
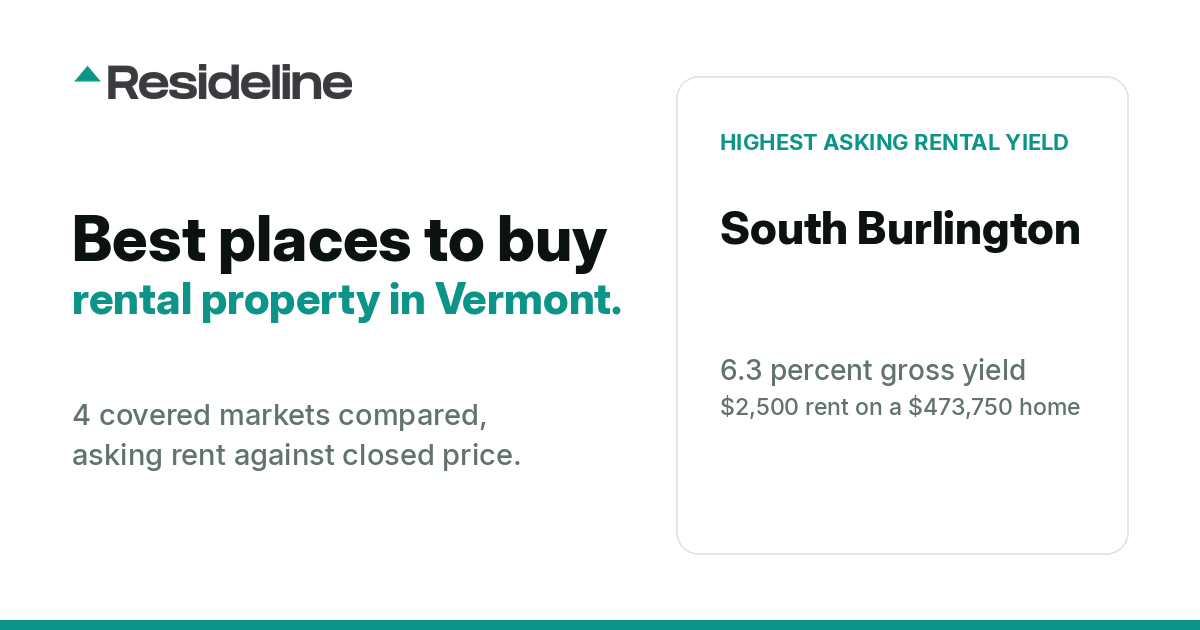
Best Places to Buy Rental Property in Vermont (2026)
Four covered Vermont markets compared on asking rental yield, 5.8 percent to 6.3 percent, using tracked home sales and rental listings; coverage explained below.
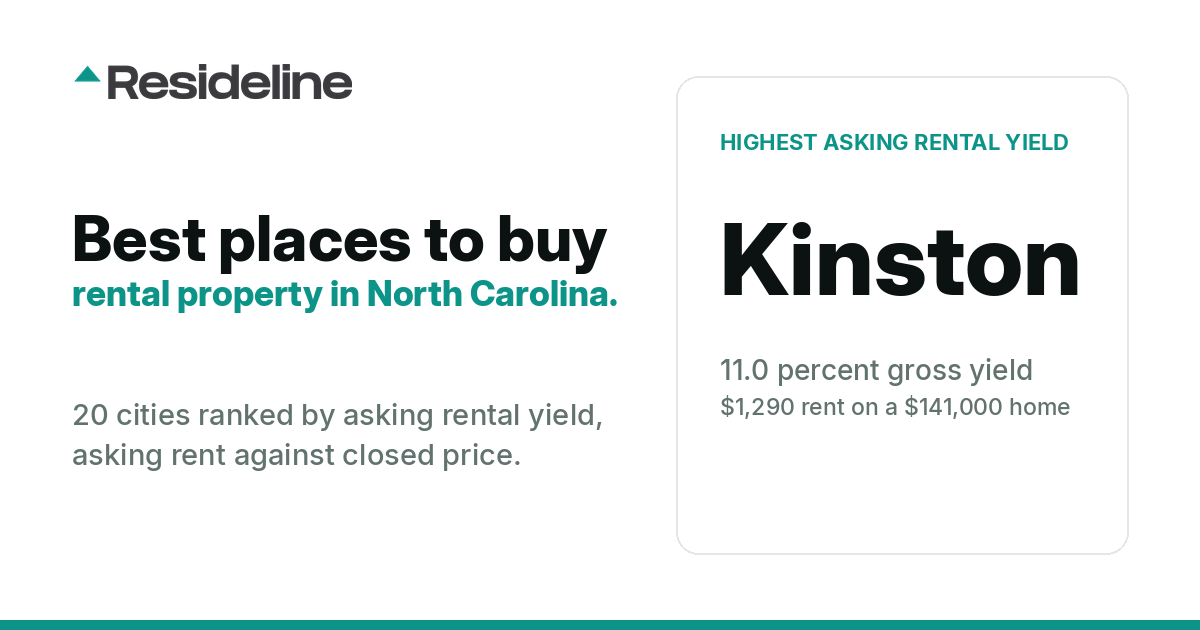
Best Places to Buy Rental Property in North Carolina (2026)
Twenty North Carolina cities ranked by asking rental yield, from 11.0 percent in Kinston to 7.3 percent in Garner, using tracked home sales and rental listings; geographic coverage explained below.
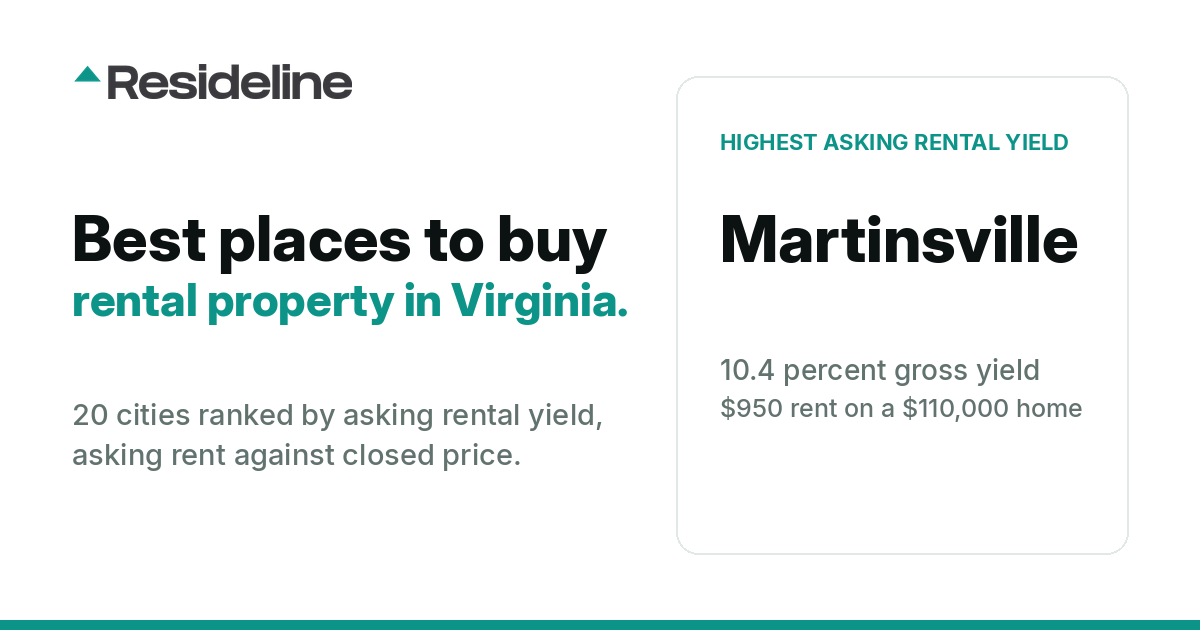
Best Places to Buy Rental Property in Virginia (2026)
Twenty Virginia cities ranked by asking rental yield, from 10.4 percent in Martinsville to 6.7 percent in Christiansburg, using tracked home sales and rental listings; geographic coverage explained below.
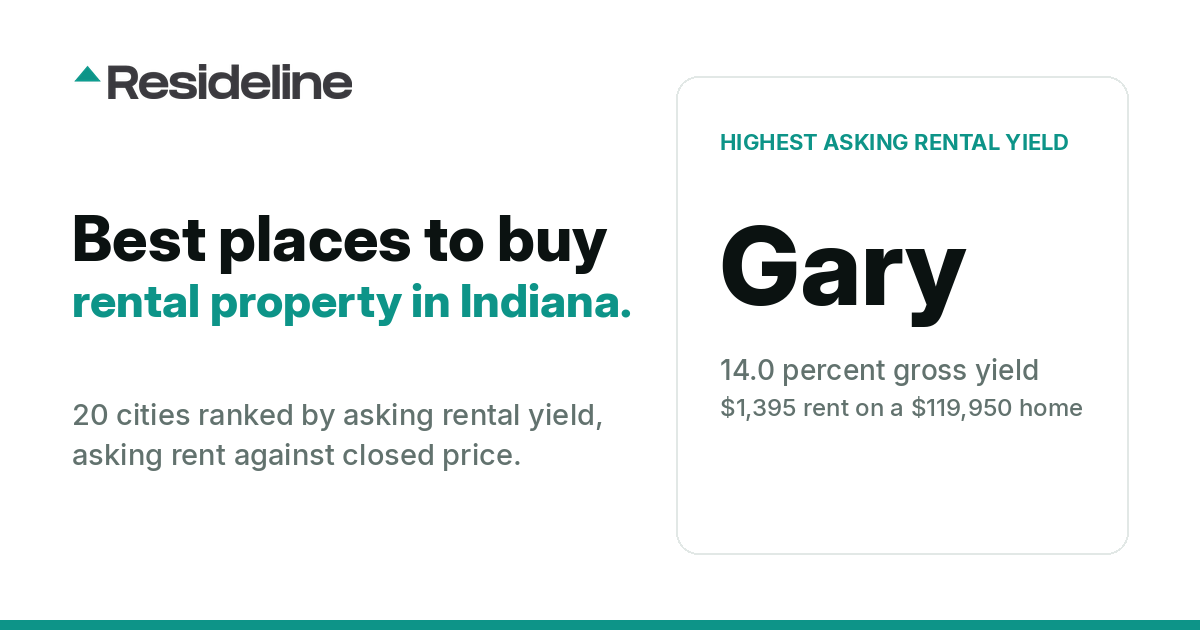
Best Places to Buy Rental Property in Indiana (2026)
Twenty Indiana cities ranked by asking rental yield, from 14.0 percent in Gary to 7.4 percent in Greenfield, using tracked home sales and rental listings; geographic coverage explained below.
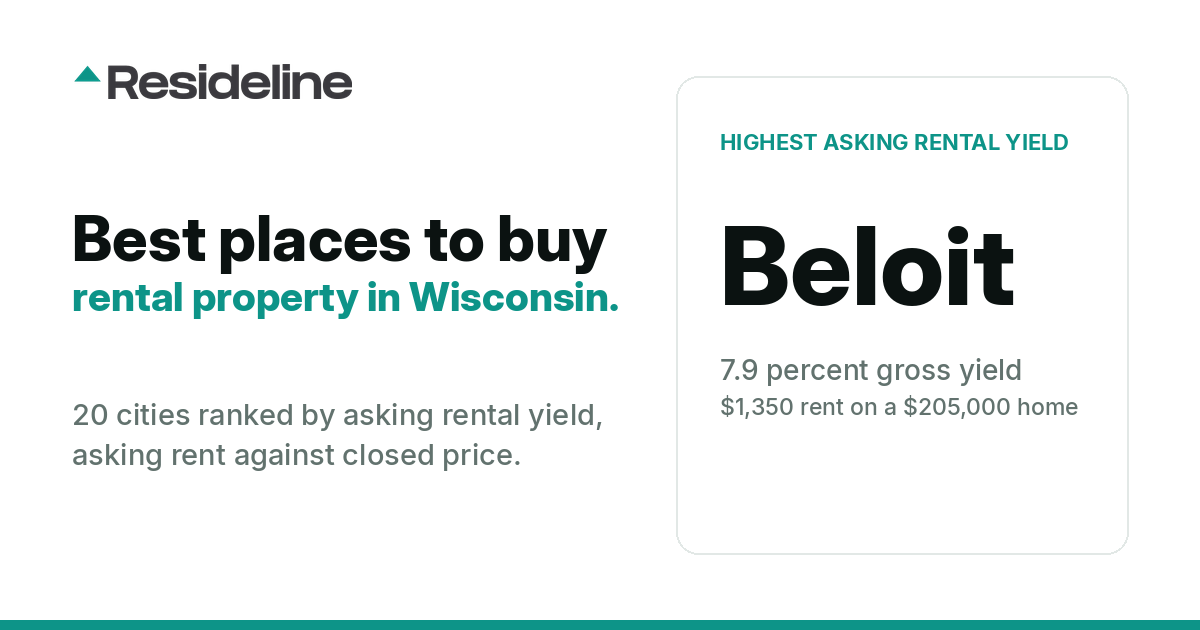
Best Places to Buy Rental Property in Wisconsin (2026)
Twenty Wisconsin cities ranked by asking rental yield, from 7.9 percent in Beloit to 5.3 percent in Green Bay, using tracked home sales and rental listings; geographic coverage explained below.
Best Places to Buy Rental Property in Iowa (2026)
Twenty Iowa cities ranked by asking rental yield, from 9.2 percent in Burlington to 5.3 percent in Marion, using tracked home sales and rental listings; geographic coverage explained below.
Best Places to Buy Rental Property in Delaware (2026)
Six Delaware cities ranked by asking rental yield, from 9.9 percent in Wilmington to 5.8 percent in Ocean View, using tracked home sales and rental listings; geographic coverage explained below.
Best Places to Buy Rental Property in North Dakota (2026)
Eight North Dakota cities ranked by asking rental yield, from 5.8 percent in Mandan to 4.0 percent in Williston, using tracked home sales and rental listings; geographic coverage explained below.
Best Places to Buy Rental Property in Ohio (2026)
Twenty Ohio cities ranked by asking rental yield, from 14.4 percent in Maple Heights to 8.6 percent in Galloway, using tracked home sales and rental listings; geographic coverage explained below.
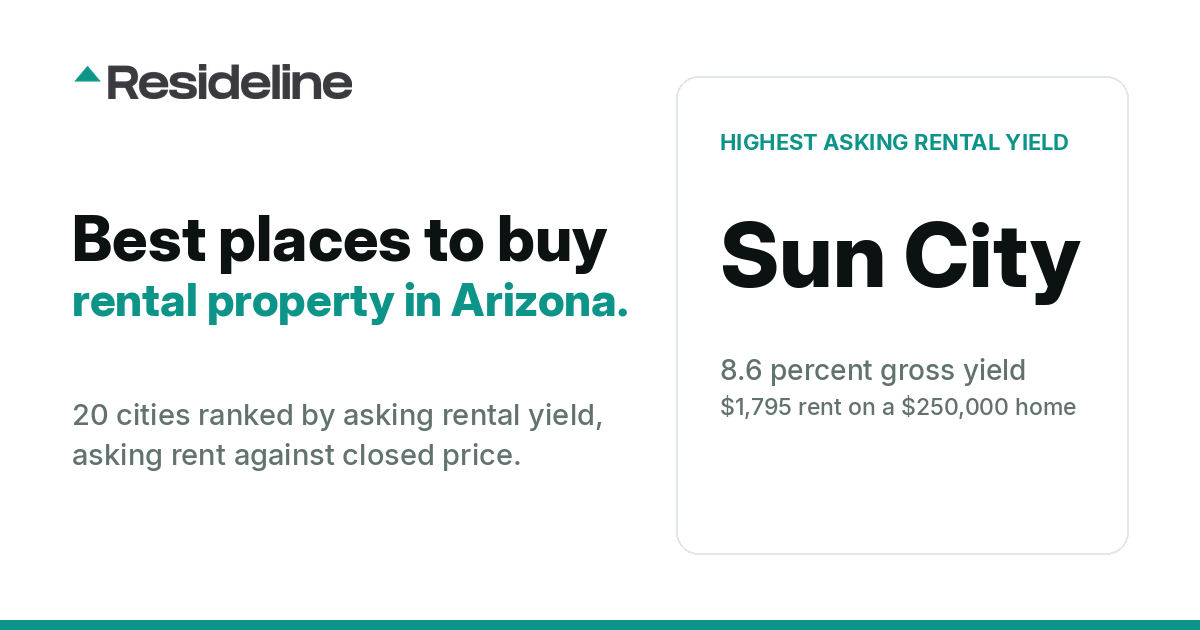
Best Places to Buy Rental Property in Arizona (2026)
Twenty Arizona cities ranked by asking rental yield, from 8.6 percent in Sun City to 6.1 percent in Oro Valley, using tracked home sales and rental listings; geographic coverage explained below.
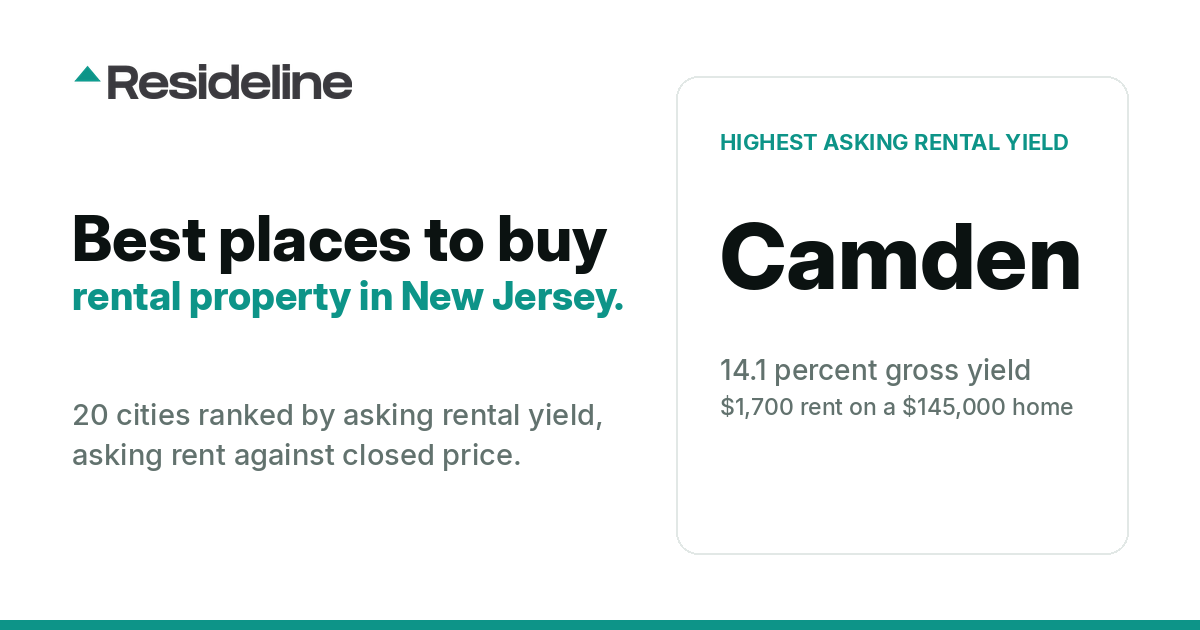
Best Places to Buy Rental Property in New Jersey (2026)
Twenty New Jersey cities ranked by asking rental yield, from 14.1 percent in Camden to 7.2 percent in Hamilton, using tracked home sales and rental listings; geographic coverage explained below.
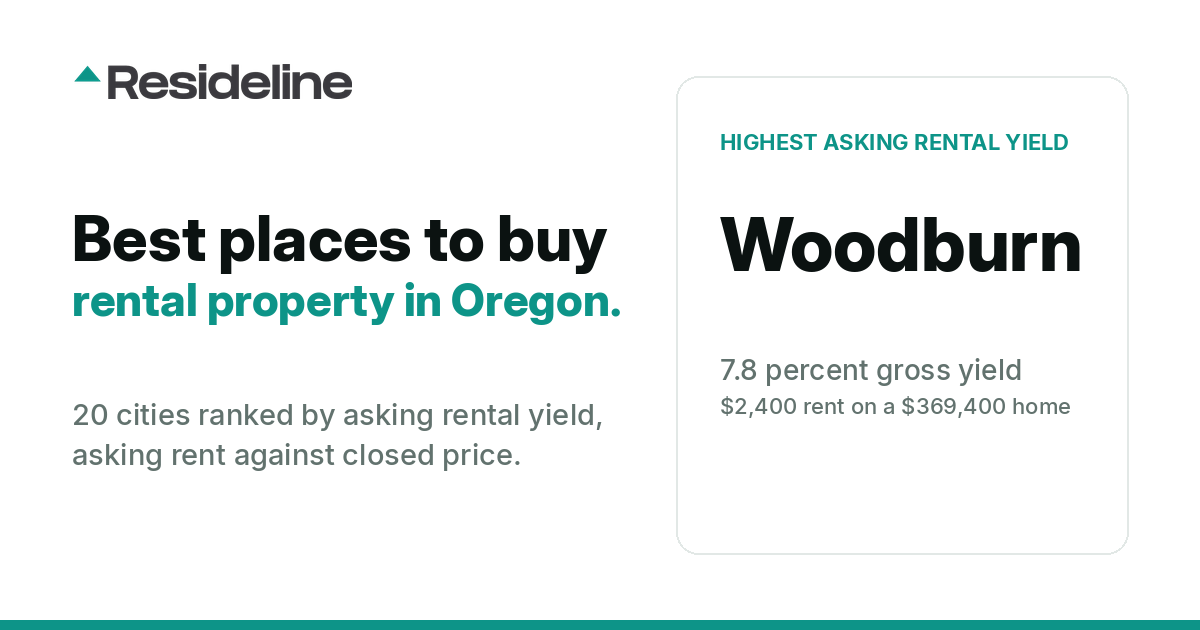
Best Places to Buy Rental Property in Oregon (2026)
Twenty Oregon cities ranked by asking rental yield, from 7.8 percent in Woodburn to 4.8 percent in Newberg, using tracked home sales and rental listings; geographic coverage explained below.
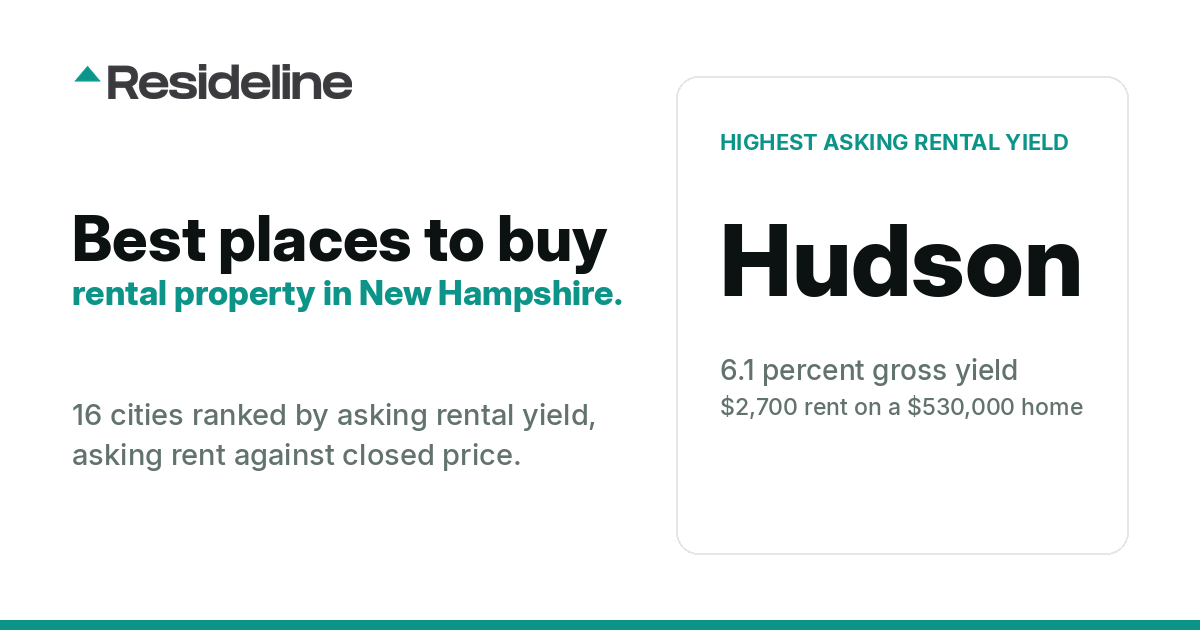
Best Places to Buy Rental Property in New Hampshire (2026)
Sixteen New Hampshire cities ranked by asking rental yield, from 6.1 percent in Hudson to 3.4 percent in Bedford, using tracked home sales and rental listings; geographic coverage explained below.
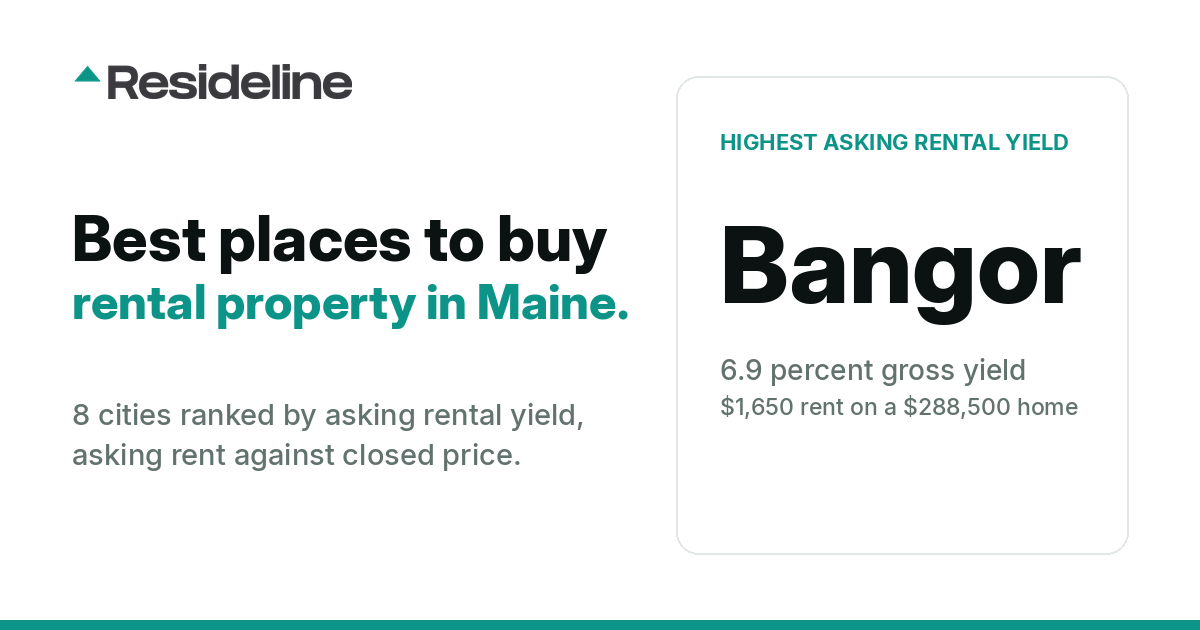
Best Places to Buy Rental Property in Maine (2026)
Eight Maine cities ranked by asking rental yield, from 6.9 percent in Bangor to 4.5 percent in Scarborough, using tracked home sales and rental listings; geographic coverage explained below.
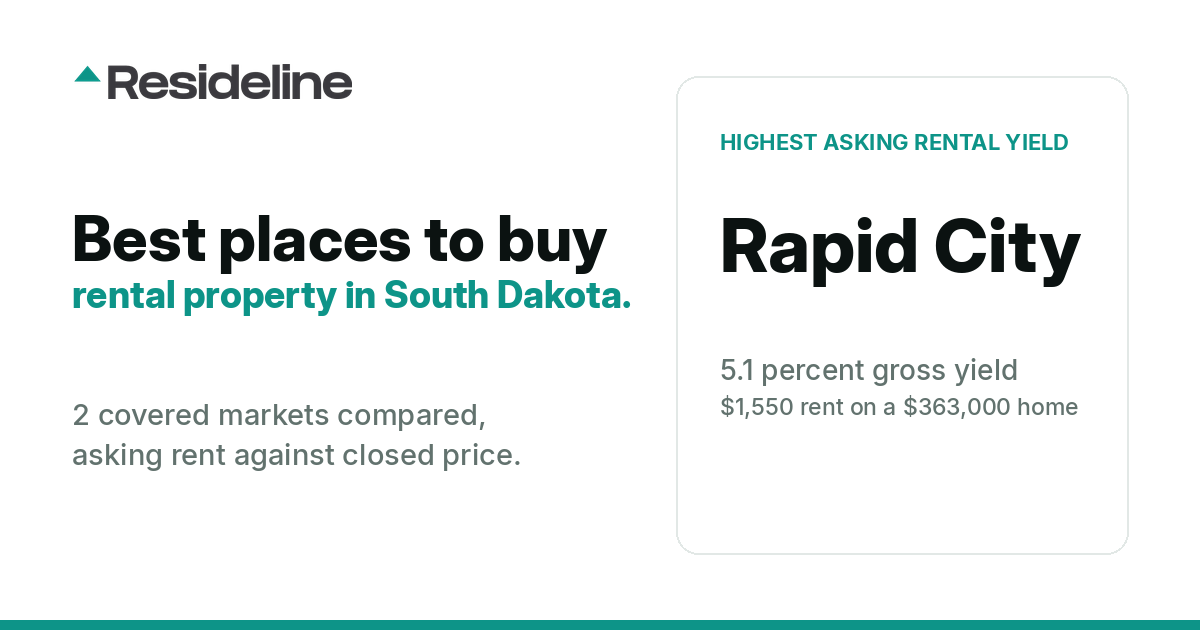
Best Places to Buy Rental Property in South Dakota (2026)
Two covered South Dakota markets compared on asking rental yield, 4.4 percent to 5.1 percent, using tracked home sales and rental listings; coverage explained below.
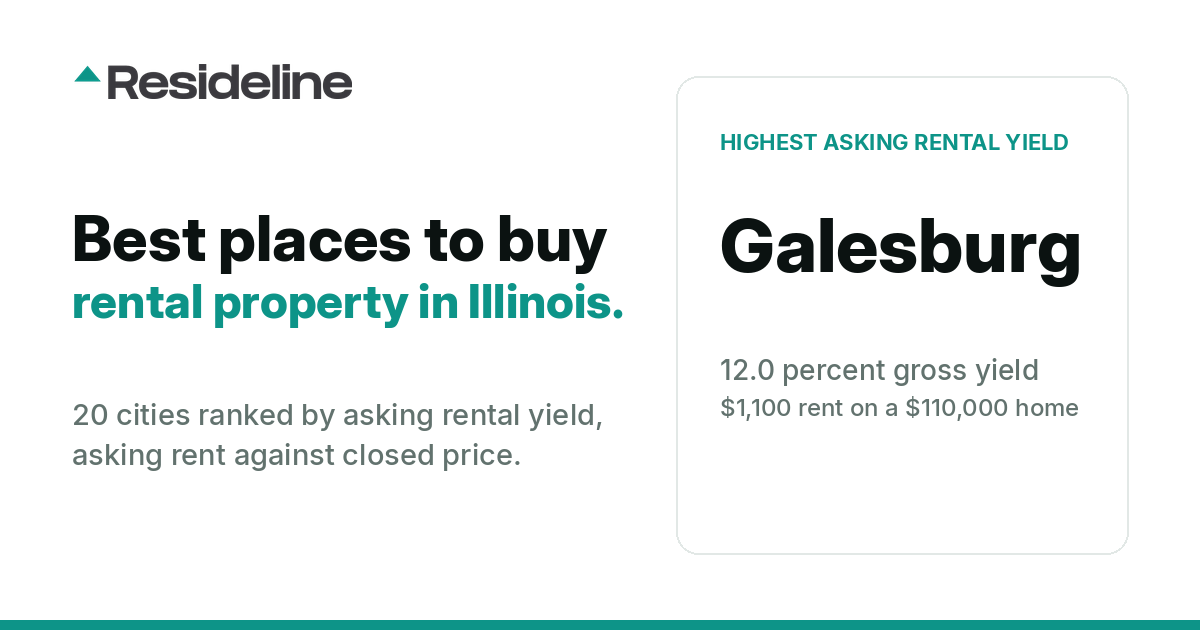
Best Places to Buy Rental Property in Illinois (2026)
Twenty Illinois cities ranked by asking rental yield, from 12.0 percent in Galesburg to 8.7 percent in Bolingbrook, using tracked home sales and rental listings; geographic coverage explained below.
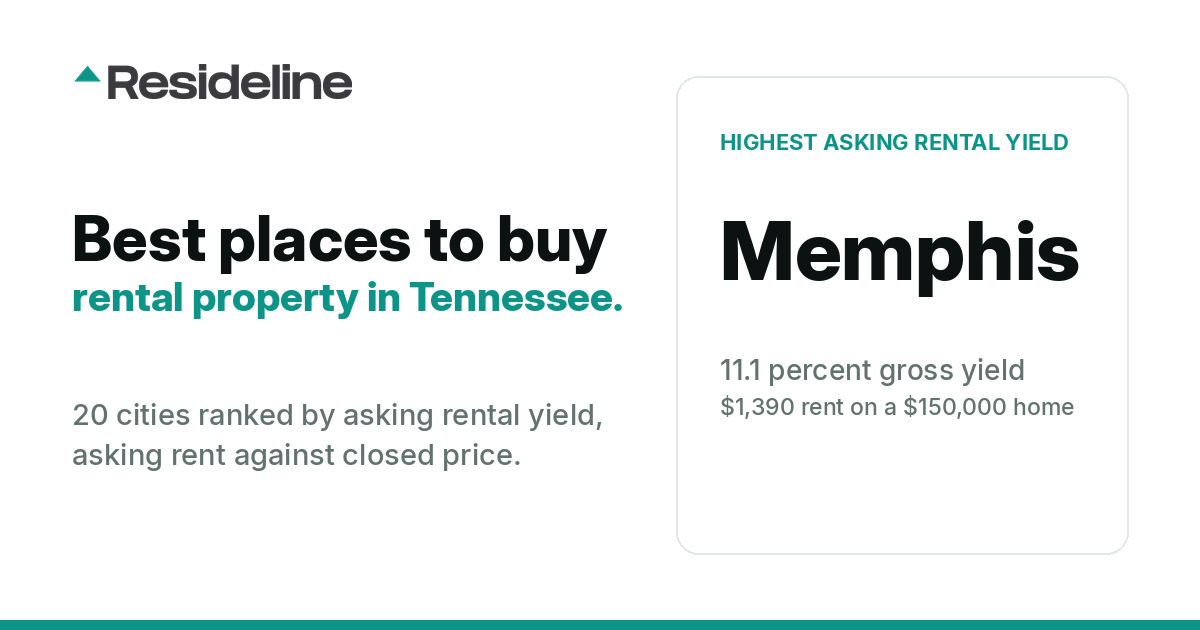
Best Places to Buy Rental Property in Tennessee (2026)
Twenty Tennessee cities ranked by asking rental yield, from 11.1 percent in Memphis to 6.5 percent in Elizabethton, using tracked home sales and rental listings; geographic coverage explained below.
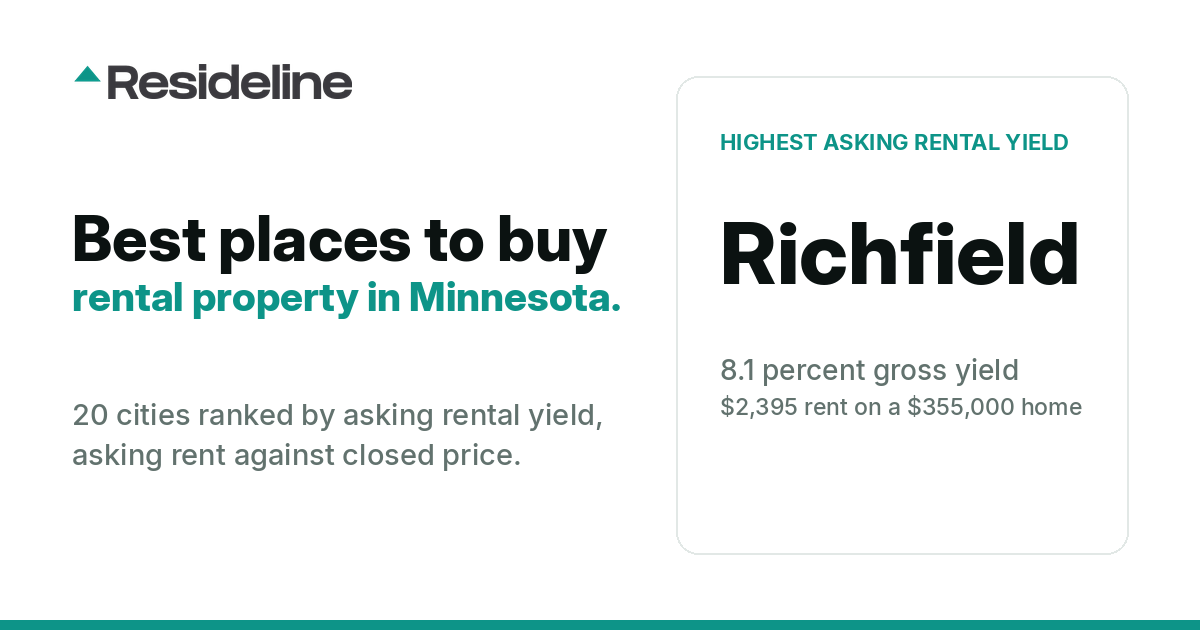
Best Places to Buy Rental Property in Minnesota (2026)
Twenty Minnesota cities ranked by asking rental yield, from 8.1 percent in Richfield to 6.6 percent in Cottage Grove, using tracked home sales and rental listings; geographic coverage explained below.
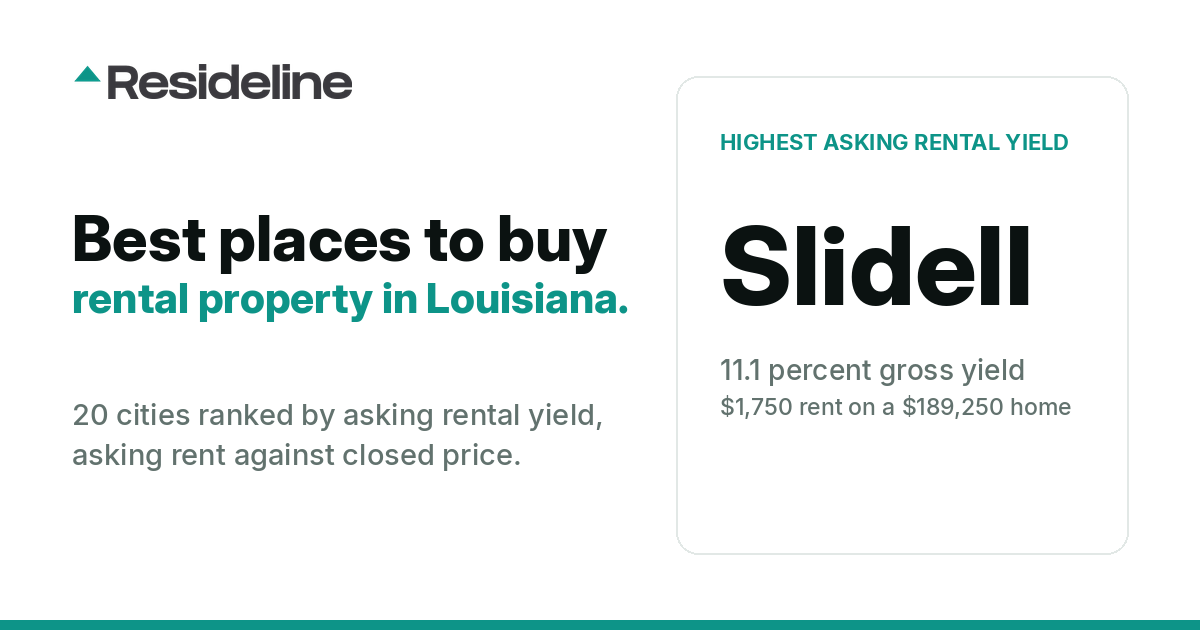
Best Places to Buy Rental Property in Louisiana (2026)
Twenty Louisiana cities ranked by asking rental yield, from 11.1 percent in Slidell to 6.7 percent in Shreveport, using tracked home sales and rental listings; geographic coverage explained below.
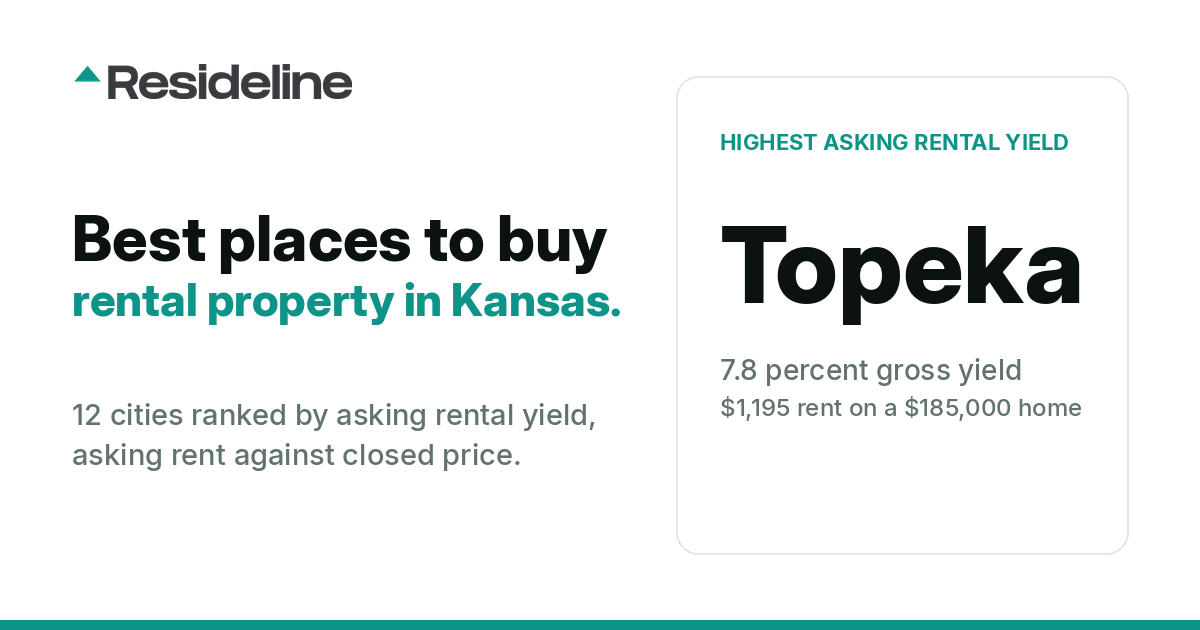
Best Places to Buy Rental Property in Kansas (2026)
Twelve Kansas cities ranked by asking rental yield, from 7.8 percent in Topeka to 2.6 percent in Leawood, using tracked home sales and rental listings; geographic coverage explained below.
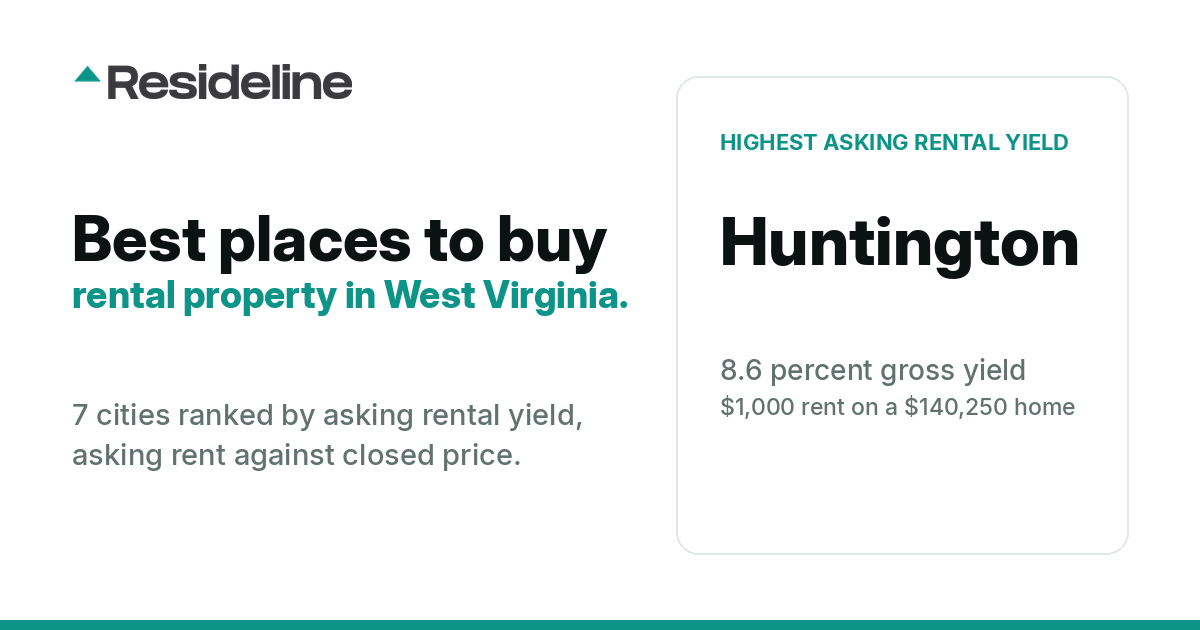
Best Places to Buy Rental Property in West Virginia (2026)
Seven West Virginia cities ranked by asking rental yield, from 8.6 percent in Huntington to 5.8 percent in Morgantown, using tracked home sales and rental listings; geographic coverage explained below.
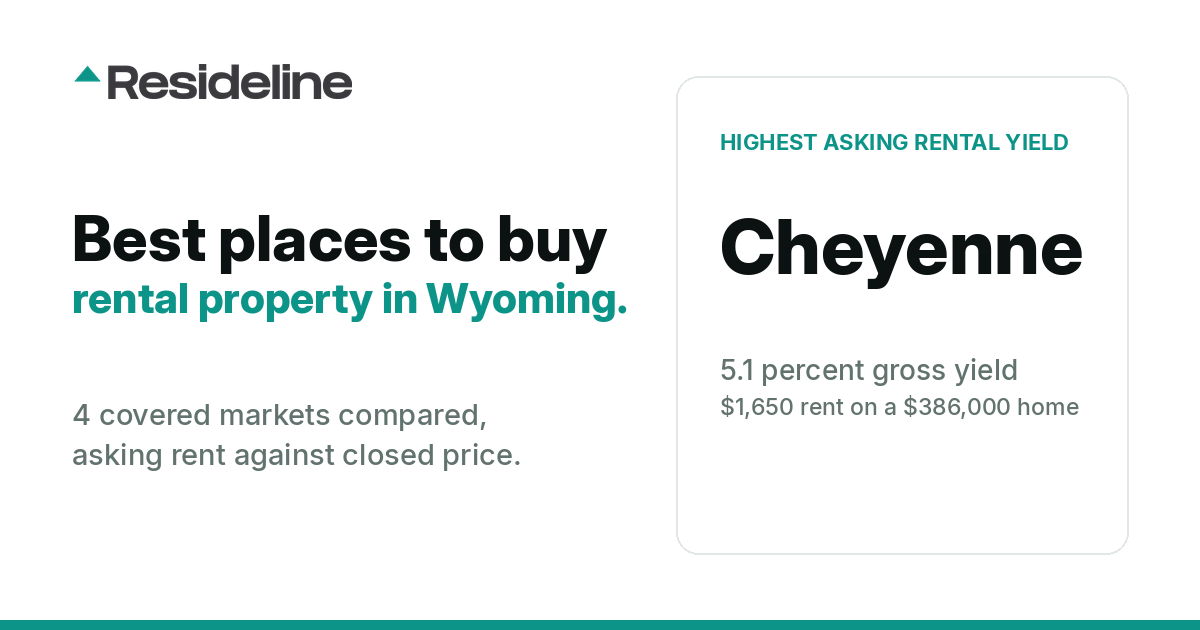
Best Places to Buy Rental Property in Wyoming (2026)
Four covered Wyoming markets compared on asking rental yield, 3.6 percent to 5.1 percent, using tracked home sales and rental listings; coverage explained below.
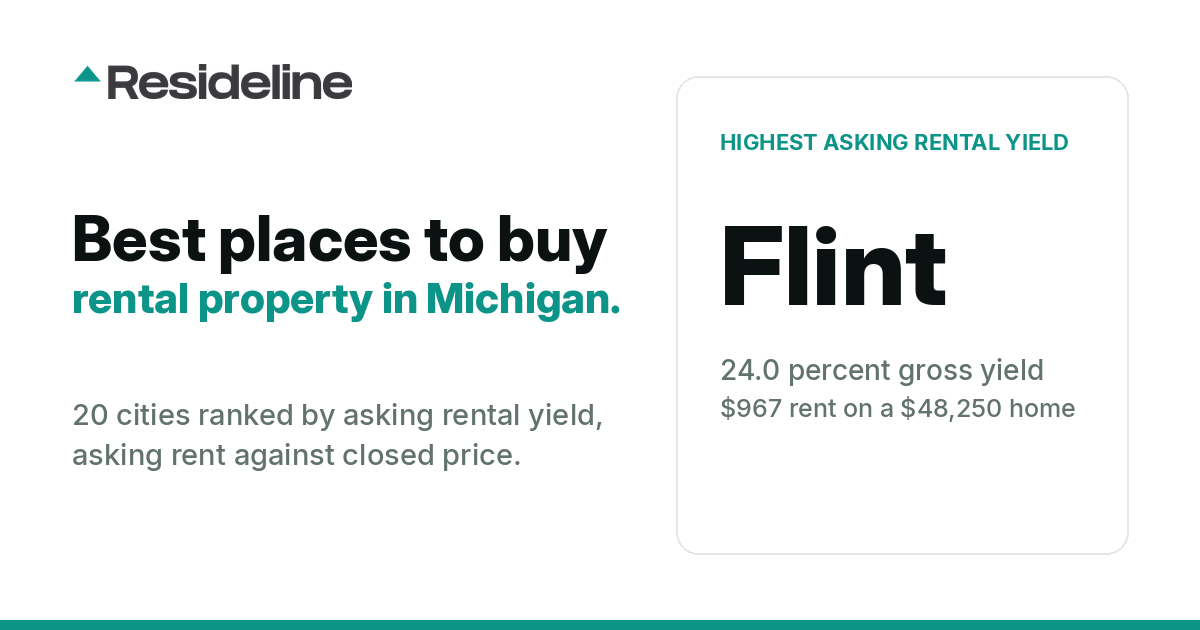
Best Places to Buy Rental Property in Michigan (2026)
Twenty Michigan cities ranked by asking rental yield, from 24.0 percent in Flint to 8.8 percent in Oak Park, using tracked home sales and rental listings; geographic coverage explained below.
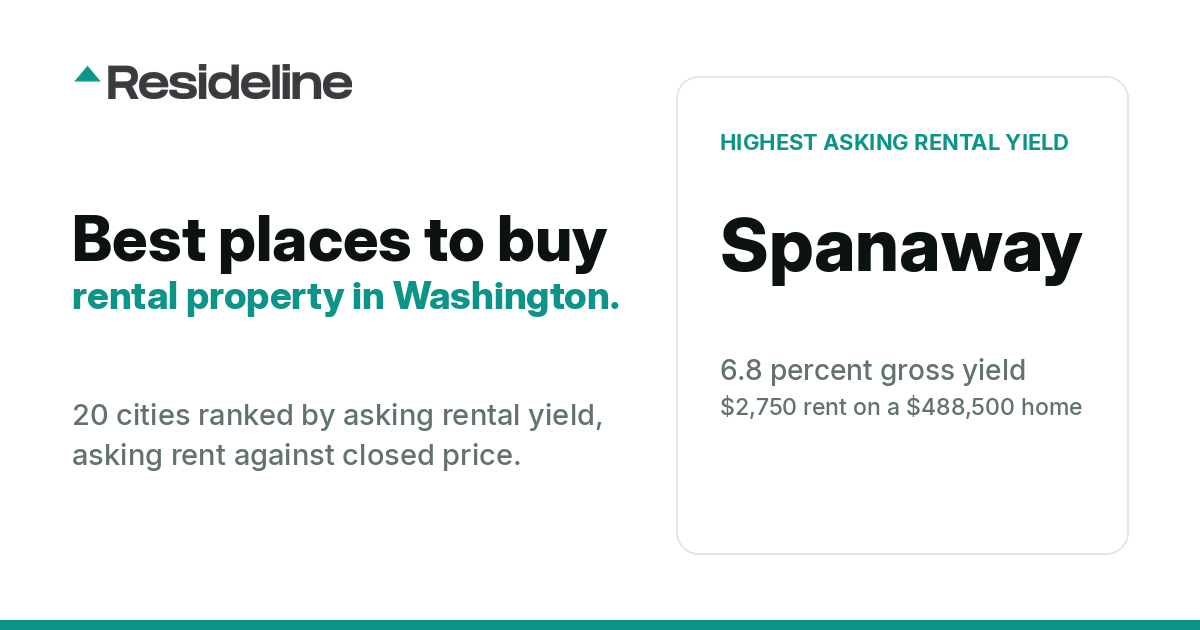
Best Places to Buy Rental Property in Washington (2026)
Twenty Washington cities ranked by asking rental yield, from 6.8 percent in Spanaway to 5.6 percent in Bremerton, using tracked home sales and rental listings; geographic coverage explained below.
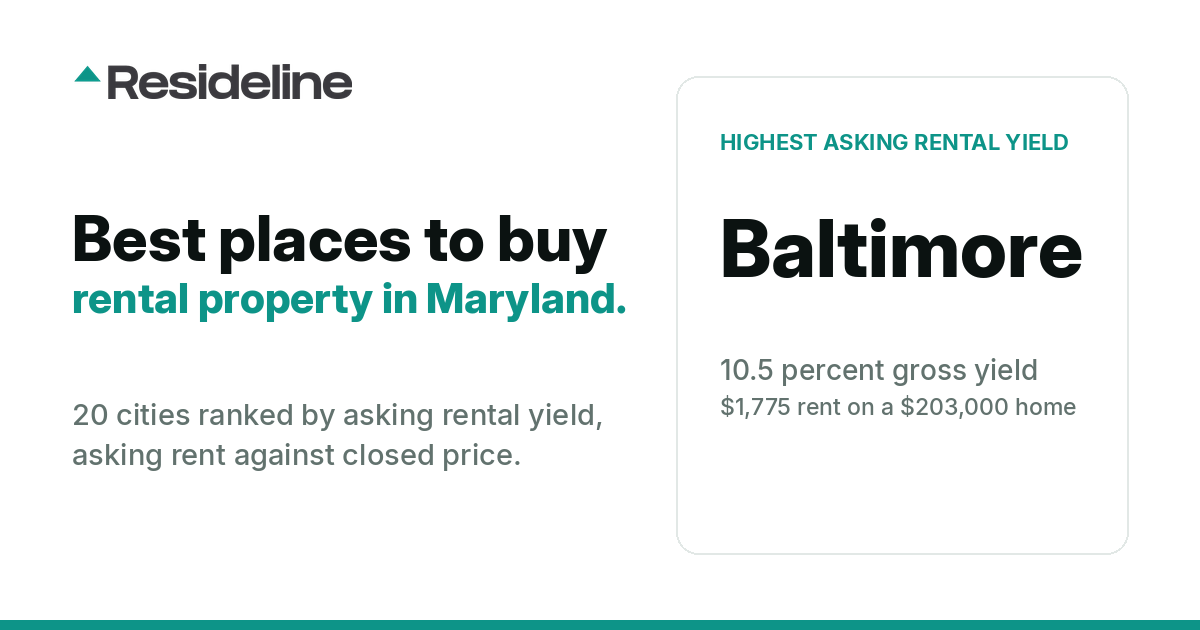
Best Places to Buy Rental Property in Maryland (2026)
Twenty Maryland cities ranked by asking rental yield, from 10.5 percent in Baltimore to 7.0 percent in Crofton, using tracked home sales and rental listings; geographic coverage explained below.
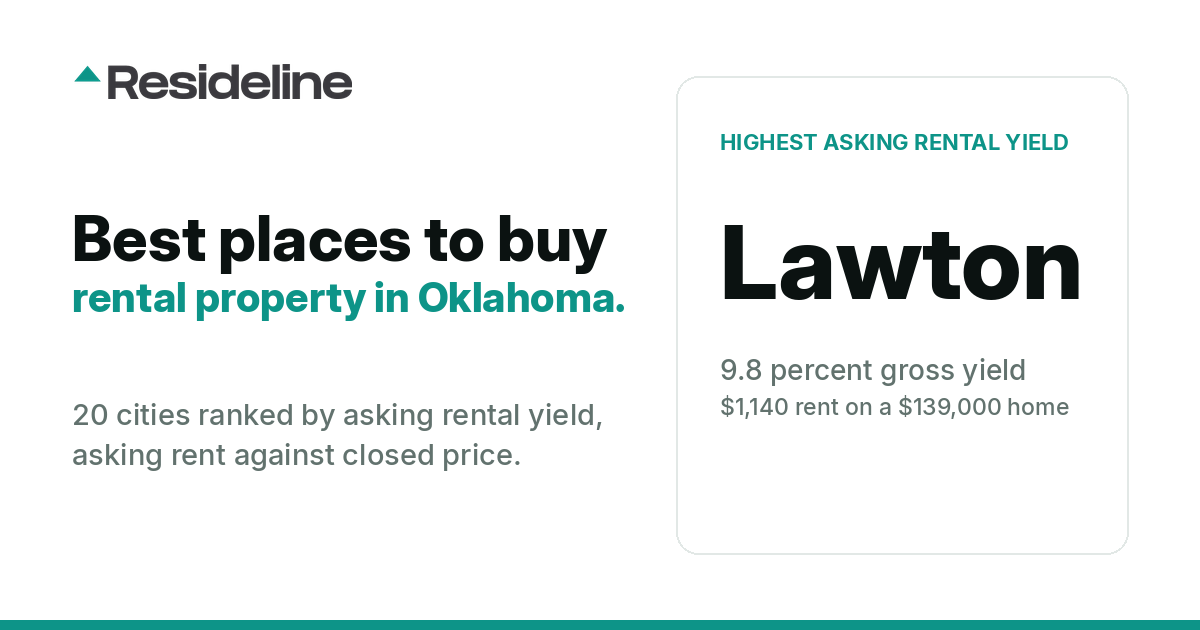
Best Places to Buy Rental Property in Oklahoma (2026)
Twenty Oklahoma cities ranked by asking rental yield, from 9.8 percent in Lawton to 6.7 percent in Bartlesville, using tracked home sales and rental listings; geographic coverage explained below.
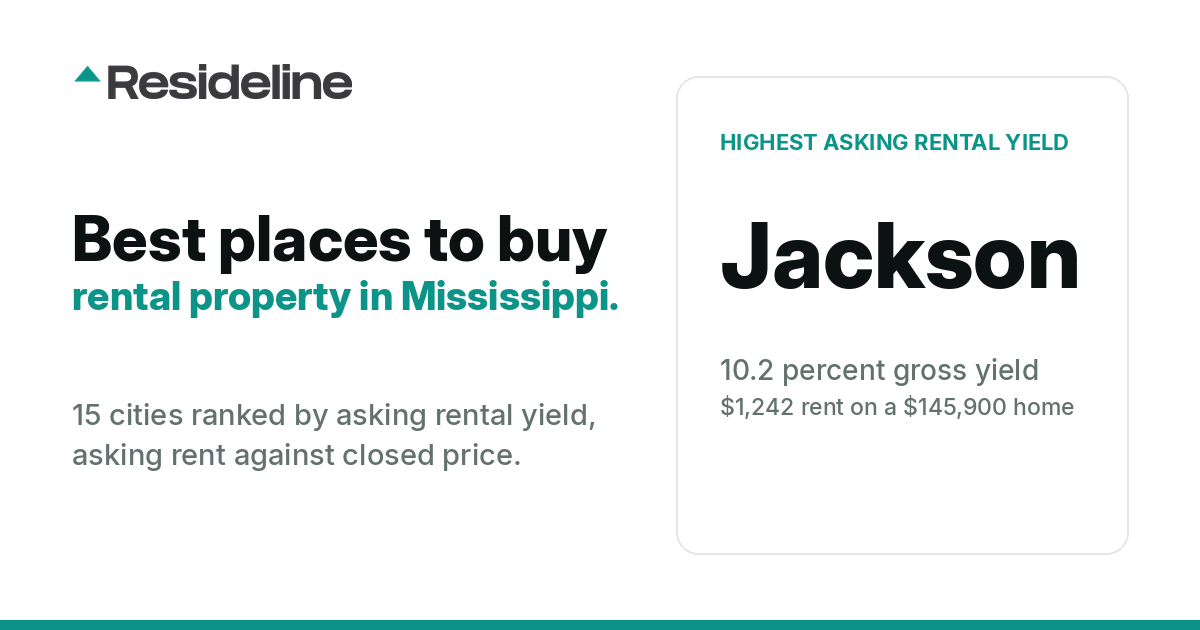
Best Places to Buy Rental Property in Mississippi (2026)
Fifteen Mississippi cities ranked by asking rental yield, from 10.2 percent in Jackson to 5.1 percent in Bay Saint Louis, using tracked home sales and rental listings; geographic coverage explained below.
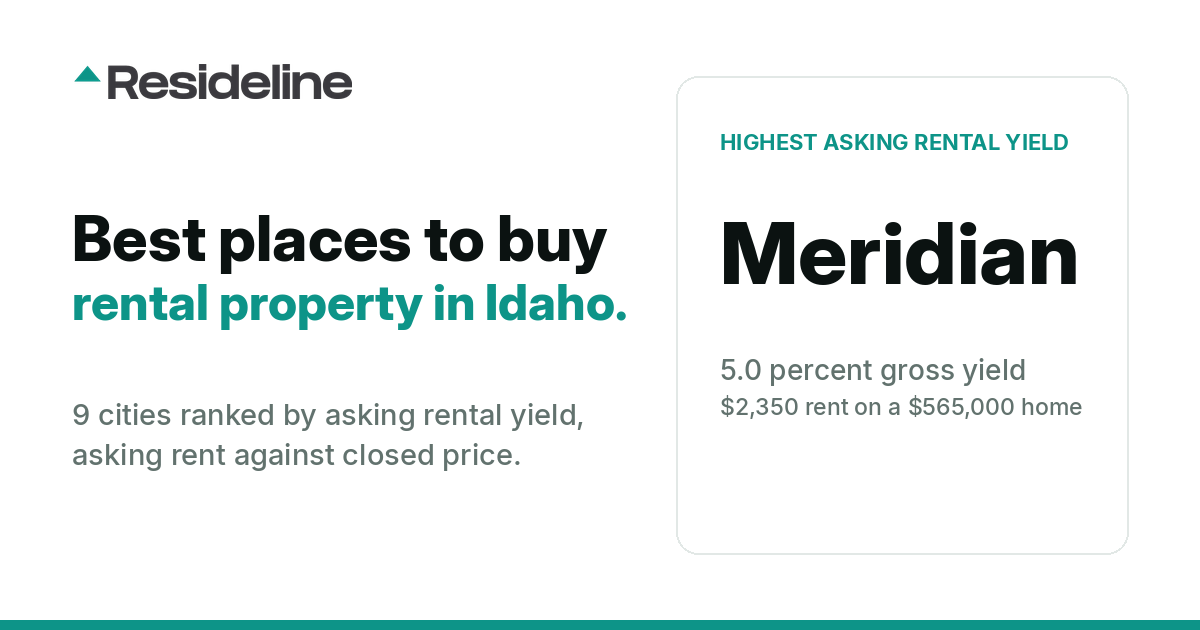
Best Places to Buy Rental Property in Idaho (2026)
Nine Idaho cities ranked by asking rental yield, from 5.0 percent in Meridian to 3.8 percent in Coeur D Alene, using tracked home sales and rental listings; geographic coverage explained below.
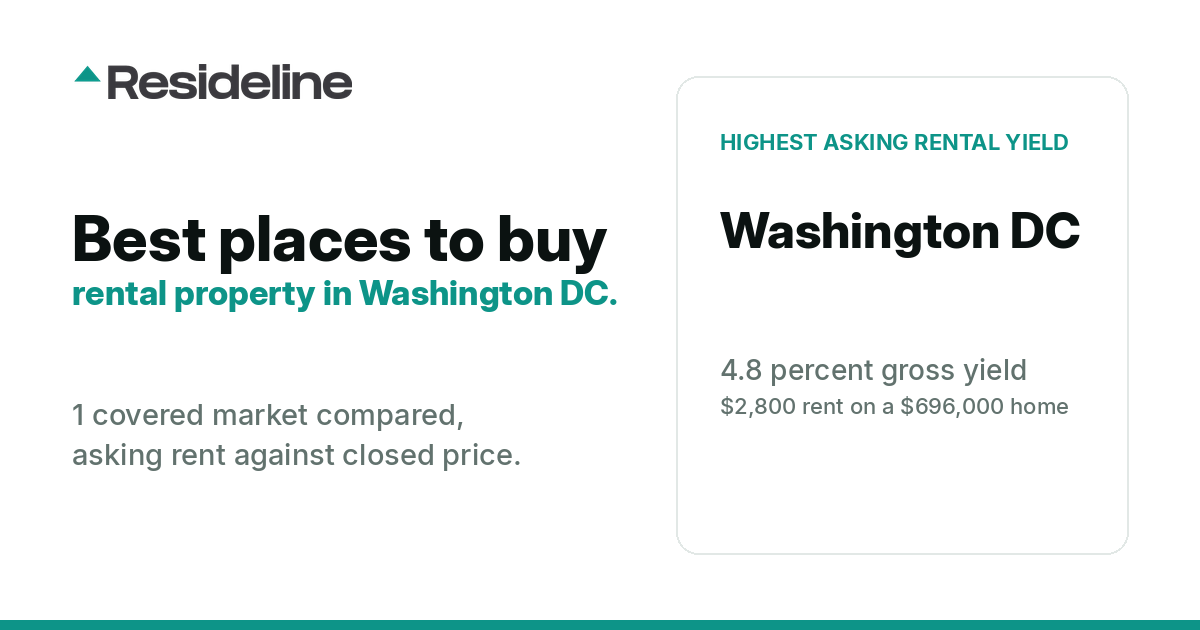
Best Places to Buy Rental Property in Washington DC (2026)
One covered Washington DC market described on asking rental yield, 4.8 percent, using tracked home sales and rental listings; coverage explained below.
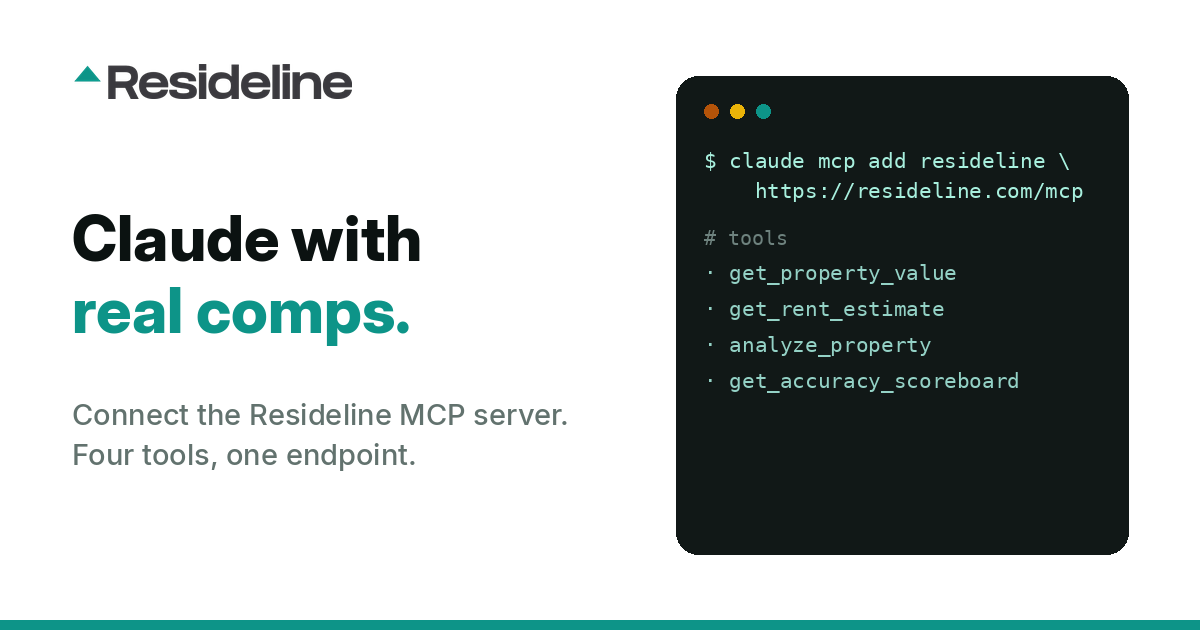
How to Analyze Real Estate Deals with Claude Using MCP
Ask an LLM what a house is worth and it guesses. Connect it to Resideline's remote MCP server and it calls live valuation, rent, and comp tools instead. Setup, tools, costs, and caveats for developers.
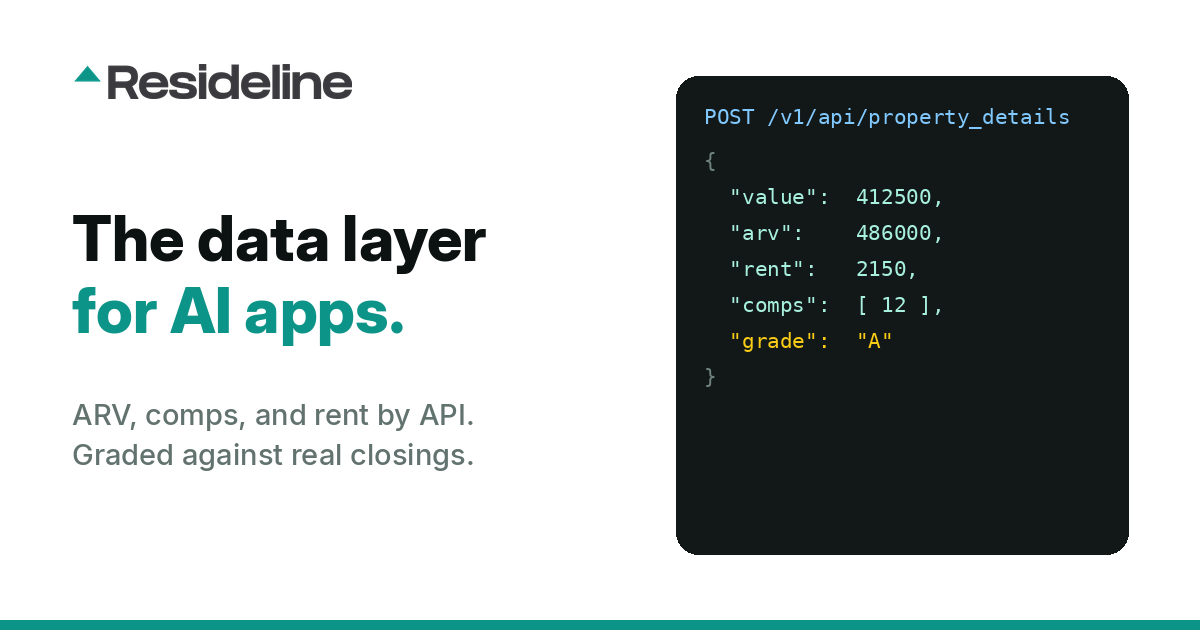
The Real Estate Data API for AI Apps: ARV, Comps, and Rent
AI proptech apps fail at the data layer, not the model. Here is the developer view of the Resideline real estate data API: endpoints, credit costs, REST vs MCP, and accuracy you can verify.
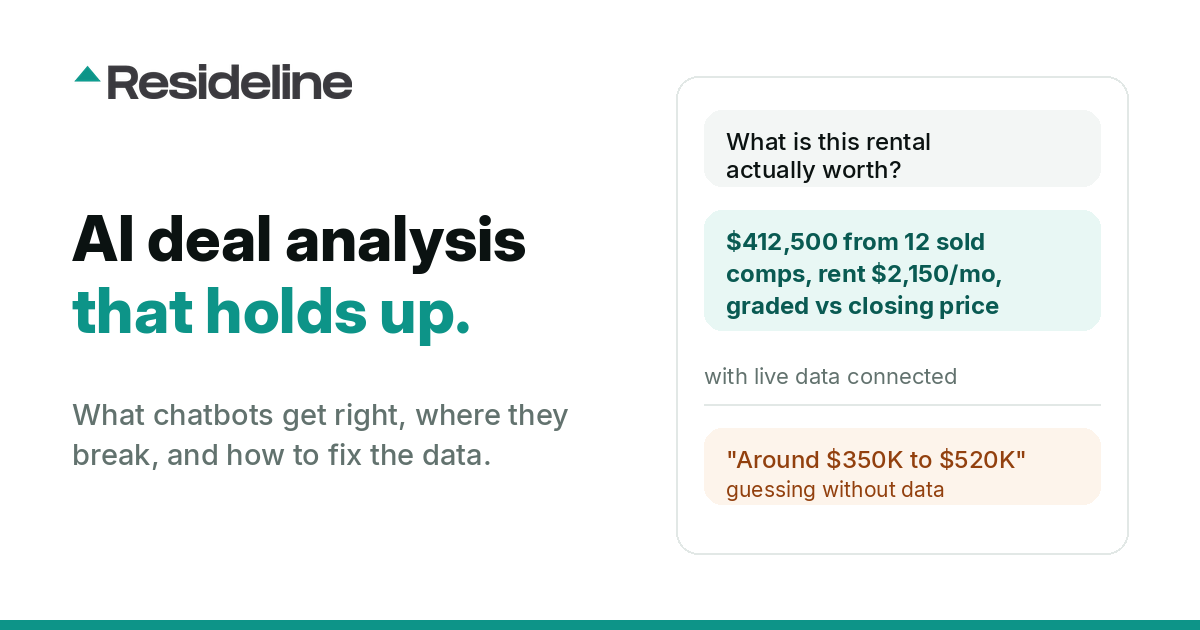
Using ChatGPT for Real Estate Deal Analysis: What Works and What Breaks
General AI is excellent at deal structure and math, and unreliable on values, comps, and rents because it has no live market data. Here is the split, the test to run, and the fix.
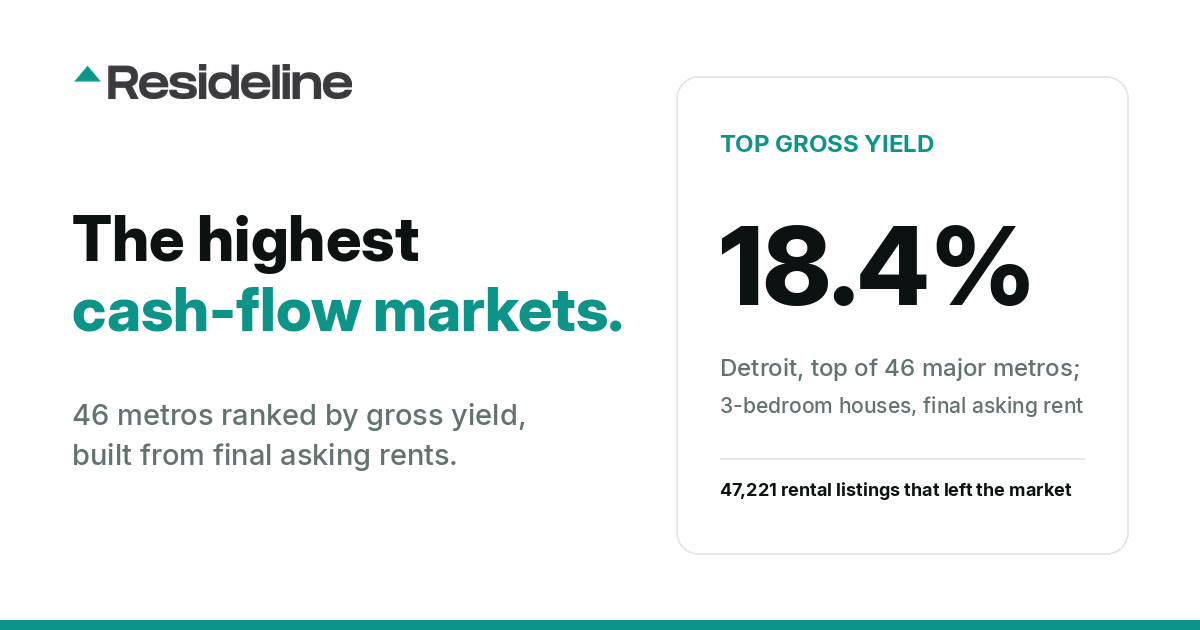
The Highest Cash-Flow Housing Markets in America (2026)
We ranked 46 major US metros by gross rental yield built from 47,221 observed rents, the last price each rental listing showed before it left the market. Detroit tops the list near 18 percent; coastal California sits at the bottom.

How Property Condition Affects Home Value: As-Is, ARV, and What AVMs Miss
Two identical-on-paper homes can sell $115,000 apart. The difference is condition, the one input most automated valuations cannot see. Here is how condition drives value, why the gap between as-is and ARV is where investors profit, and how Resideline reads condition from the listing photos.
Expected Sale Price: what a listed home will actually close for
For a home that is on the market, Resideline now shows an Expected Sale Price.
Exclude a comp and the ARV updates live
You know your market better than any model on a given street. Resideline reports now recalculate the ARV in real time as you exclude or add comps, so the number always reflects the comp set you actually trust.
Every report now includes an Area Market Snapshot
A comp is only half the picture.

Your AI assistant can now run Resideline
Resideline now speaks the Model Context Protocol. Connect Claude, ChatGPT, or Cursor and ask it to run any US address. It answers with real sold comps, a graded value, market rent, and the live accuracy scoreboard to back it up.

Email a deal, get a CMA back
Forward any listing or wholesaler blast to [email protected] and Resideline replies with a full CMA, usually within a couple of minutes. A three-property blast comes back as three reports in one reply.

Resideline Launches AVM 17: A Five-Engine Valuation System Built for Harder-to-Price Real Estate
AVM 17 pairs five purpose-built valuation engines with a routing layer that knows which one to trust, pricing condos, multi-family, rentals, thin-comp homes, and everything in between on real, verified sales. And when the data isn't there, it tells you instead of guessing.

The 2026 Guide to Vibe Coding a Real Estate Investment Dashboard
Developers are no longer bogged down by repetitive boilerplate; instead, they are vibe coding, using natural language to orchestrate complex data pipelines into high-performance tools. Learn how to build an institutional-grade deal analyzer with the Resideline API.

The 20 US Cities Where Multi-Family Rents Run Highest Against Price (2026)
Every multi-family sale we tracked over 24 months, 230 cities with 50+ sales, against asking rents inside each city's own ZIP codes. Elmira, NY leads at 20.6 percent on a single-unit basis, with every sample size printed.

Multifamily Real Estate vs the Stock Market: The 2026 Shift
As investors approach 2026, the financial landscape is undergoing a major transition. While the stock market continues its volatile relationship with fluctuating interest rates and tech valuations, a quiet crisis in housing supply is creating a massive opening for smart capital.
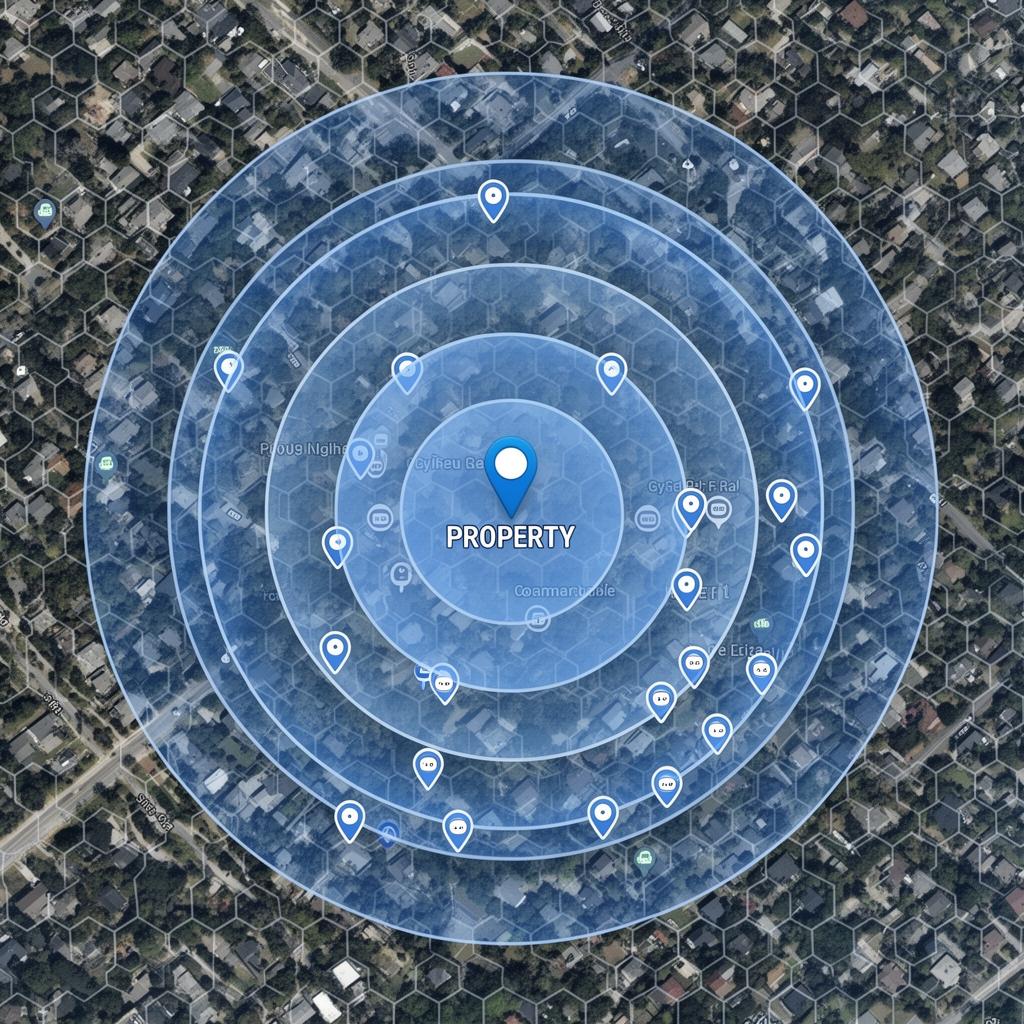
Geospatial Bracketing: The Future of Appraisal Comps
For decades, appraisers and algorithms have used the same crude tool: the 1 Mile Radius. A simple circle that blindly crosses highways, school districts, and neighborhood lines. In 2026, technology allows for something better.

Florida Condo Market Forecast 2026: Condo Line Pricing
The Florida real estate market in 2026 is defined by density. Standard valuation algorithms treat a penthouse with ocean views the same as a second floor unit facing the parking garage. Resideline solved this with Condo Line Precision.

What Is a Confidence Score in Real Estate? (And What a Low Score Really Means)
Most AVMs present valuations with false certainty. They give you a precise number regardless of how messy the data is. At Resideline, we believe this is negligent. This is why every valuation we generate comes with a Confidence Score.

Zillow vs Redfin vs Resideline: Best AVMs for Investors
While household names like Zillow and Redfin dominate the consumer search market, professional investors are turning to specialized tools for valuation. Here is how the top three platforms stack up when it comes to accuracy, speed, and transparency.

ARV vs As Is Value: Why Your Deal Calculator is Lying to You
Every real estate investor knows the feeling. You find a distressed property that looks like a great deal. You run it through a standard valuation tool, and the number comes back high. Only to realize the algorithm was comparing your gutted foreclosure to the renovated model home down the street.

The 2026 Standard: How Resideline Built the Most Advanced AVM in Real Estate
As market volatility taught investors a brutal lesson about latency, Resideline built the valuation engine of the future from the ground up. Discover how our real time 'Glass Box' AVM is defining the 2026 standard for accuracy, ARV calculations, and investment revenue projections.

Why Black Box AVMs Fail: Building a Transparent Automated Valuation Model
Most Automated Valuation Models are 'Black Boxes' that sacrifice accuracy for coverage. We took a different approach, building a valuation engine designed to think like a human appraiser, backed by the speed of a supercomputer and a radical commitment to transparency.

How Our Multi-Family Valuation Model Works
Unlike Zillow or Redfin, which often treat duplexes like single-family homes, our model values multi-family properties as businesses based on their income potential, mimicking how professional investors underwrite deals.
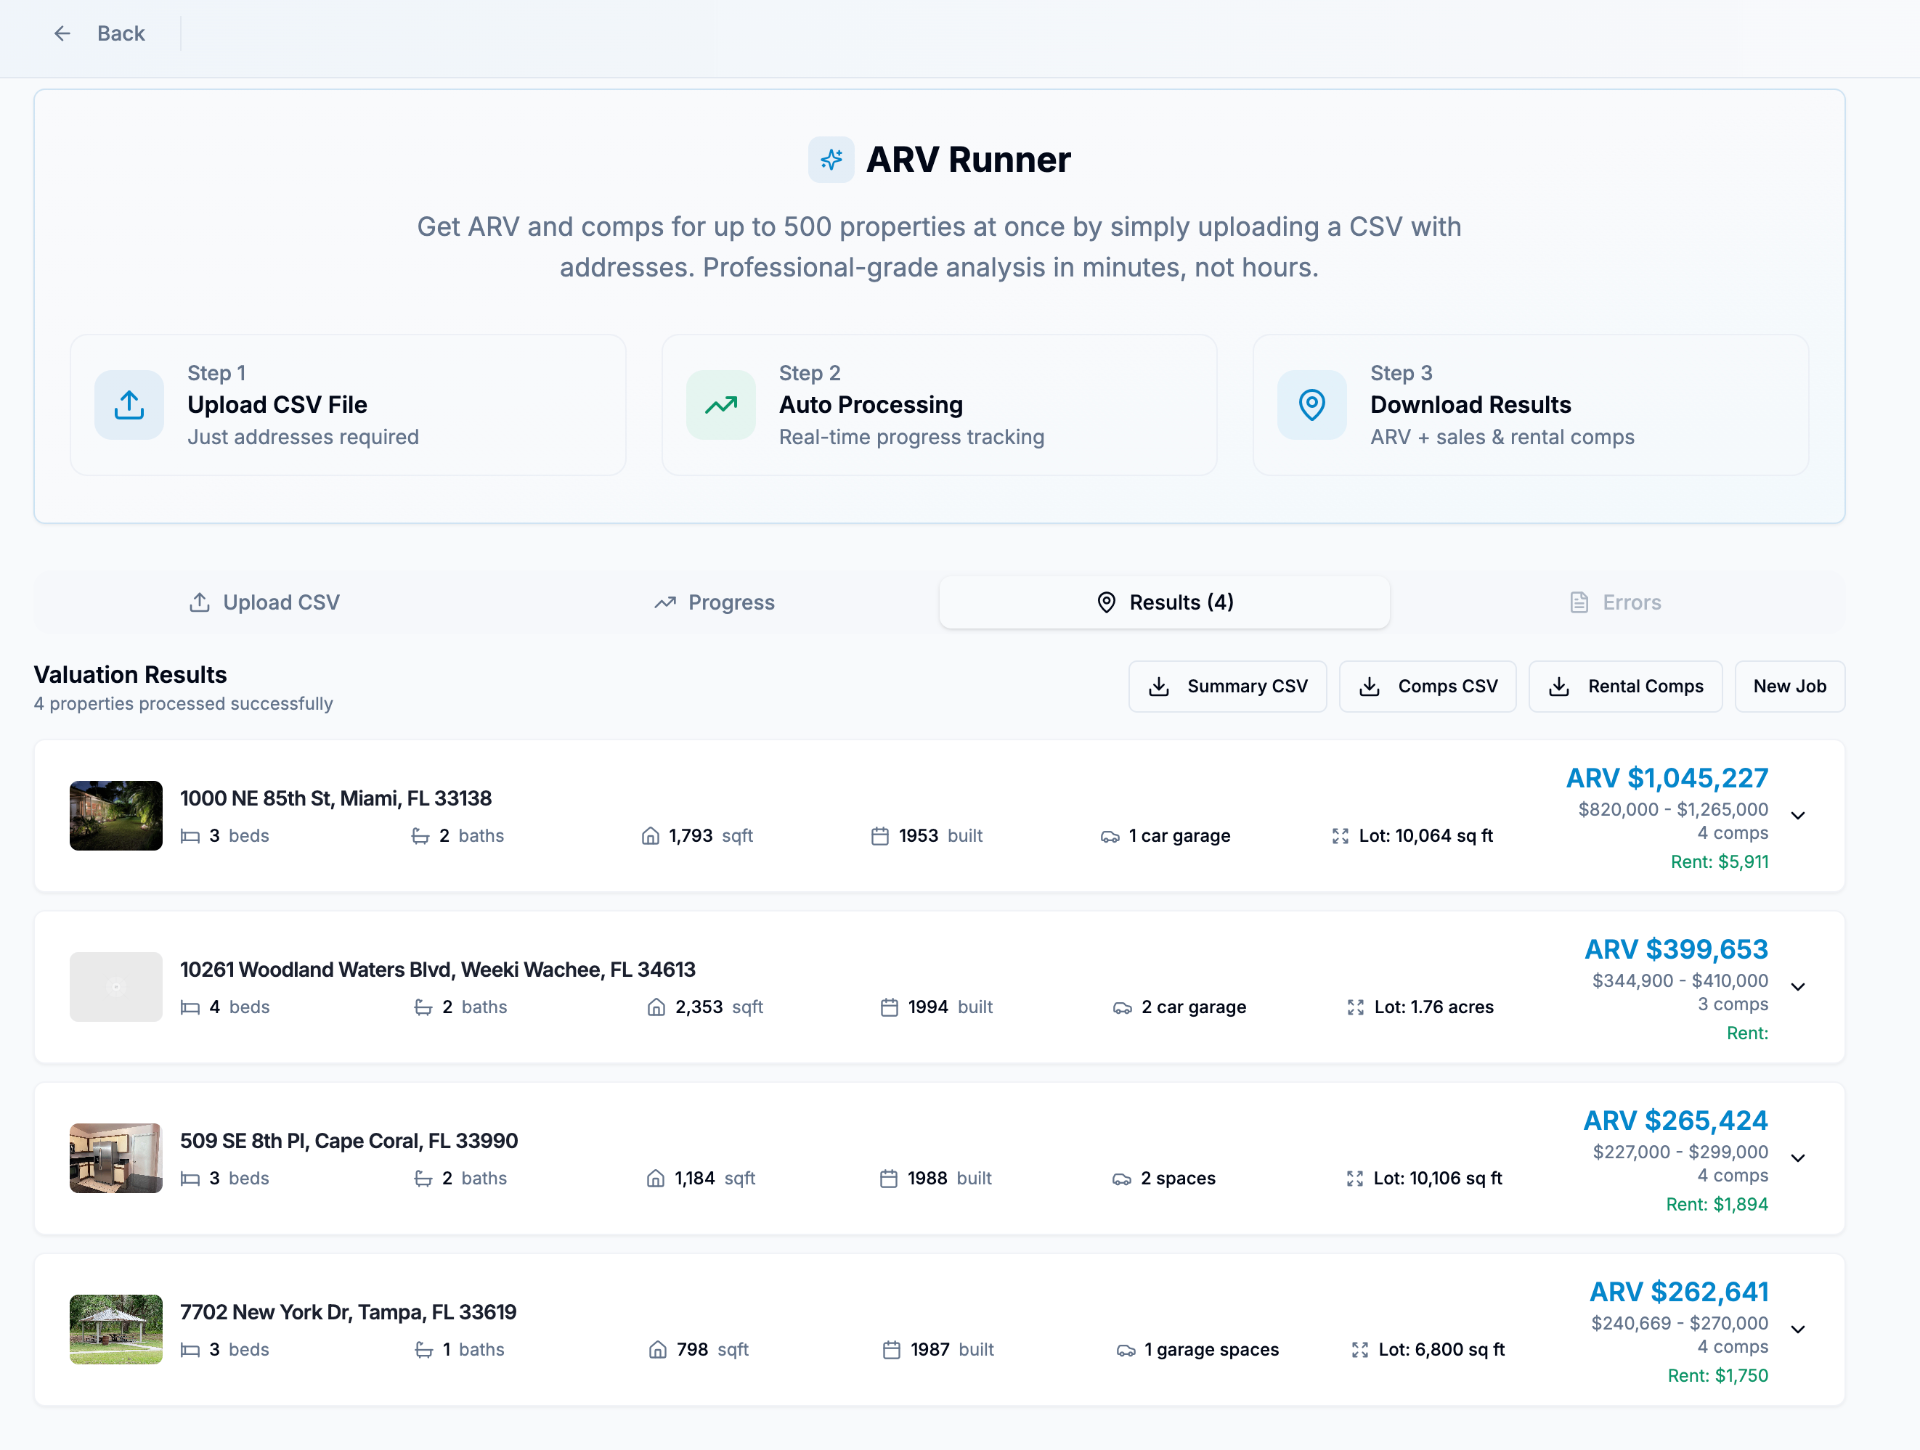
The Future of Real Estate Valuation: How Resideline Delivers Accurate ARVs with Real-Time Comps
When it comes to real estate investing, accurate ARV (After Repair Value) is everything. A single miscalculation can turn a great deal into a costly mistake. Discover how Resideline's transparent, real-time AVM platform revolutionizes property valuation.

Simplify Real Estate Investing with Instant AI Reports
Real estate investing can feel like a full-time job. You're stuck in spreadsheets for hours, pulling data from Zillow for sales, AirDNA for short-term rentals, and Rentometer for long-term rents. Resideline changes all that with automation and advanced analytics.