The Distress Language Index: Where As-Is and Investor Special Listings Concentrate
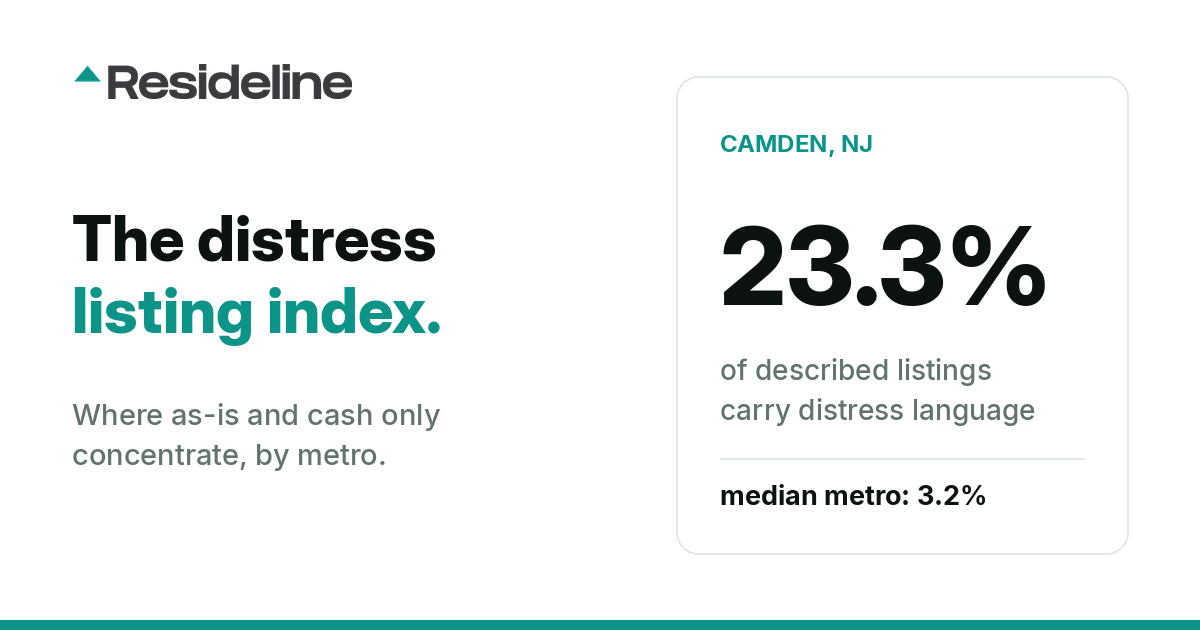
We scanned 4.9 million closed-sale listing descriptions for the phrases agents actually write, as-is, cash only, investor special, fixer, and ranked the metros where distress language concentrates. The median metro share is 3.21 percent. Camden, NJ hits 23.27 percent.
Every agent knows the vocabulary. Sold as-is. Cash only. Investor special. Needs TLC. Handyman's dream. These phrases are not filler, they are disclosures written in plain marketing English, and they appear in listing descriptions regardless of whether a property ever touches a foreclosure docket.
We wanted to know where that language concentrates. So we scanned the listing descriptions of 4,907,807 closed sales from a 365-day window and flagged every listing whose text carried distress phrasing: as-is, cash only, investor special, needs work, handyman, fixer, TLC and similar wording. Then we ranked metros by the share of described closed sales that carried at least one flag.
We call the result the Distress Language Index. It is the honest map of where distressed inventory concentrates, written in agents' own words, and because it is built from closed sales, every flagged listing represents a property that actually transacted.
What we measured
The method is deliberately simple. For each closed sale in our corpus we took the listing description, checked it against our distress phrase list, and recorded a yes or no. A metro's score is the percentage of its described closed sales that got a yes.
To keep the rankings honest, a metro needed at least 400 closed sales in the window and at least 300 of them with usable descriptions. 1,706 metros cleared both bars out of the 2,235 metros in our sold corpus.
The national baseline
Across those 1,706 qualifying metros, the median share of closed-sale descriptions carrying distress language is 3.21 percent. Call it the background rate: in a typical American metro, roughly one listing in thirty tells you up front that the property needs something.
The top of the distribution looks nothing like that.
The 15 metros with the most distress language
| Rank | Metro | Closed sales | With descriptions | Distress share |
|---|---|---|---|---|
| 1 | Camden, NJ | 750 | 739 | 23.27% |
| 2 | Jackson, MS | 1,316 | 1,294 | 21.64% |
| 3 | Pekin, IL | 633 | 620 | 19.52% |
| 4 | Granite City, IL | 598 | 594 | 17.17% |
| 5 | Gary, IN | 989 | 960 | 16.88% |
| 6 | Rockford, IL | 2,615 | 2,570 | 16.46% |
| 7 | Vineland, NJ | 748 | 735 | 16.46% |
| 8 | Petersburg, VA | 774 | 753 | 16.20% |
| 9 | Alton, IL | 547 | 539 | 16.14% |
| 10 | Millville, NJ | 612 | 586 | 15.87% |
| 11 | Quincy, IL | 735 | 721 | 15.26% |
| 12 | Springfield, IL | 1,902 | 1,863 | 14.49% |
| 13 | Peoria, IL | 2,136 | 2,096 | 14.31% |
| 14 | Collinsville, IL | 548 | 538 | 14.31% |
| 15 | Loves Park, IL | 586 | 582 | 14.26% |
Two patterns stand out in the table itself.
- •Illinois dominates. Nine of the fifteen highest-scoring metros are in Illinois: Pekin, Granite City, Rockford, Alton, Quincy, Springfield, Peoria, Collinsville and Loves Park. This is not a small-sample artifact. Rockford's 16.46 percent comes from 2,570 described sales, and Peoria's 14.31 percent comes from 2,096.
- •South Jersey clusters. Camden, Vineland and Millville all make the top ten, three metros from the same corner of one state.
Gary, IN at 16.88 percent and Petersburg, VA at 16.20 percent round out a list that reads like a tour of legacy industrial towns and aging housing stock, places where a large share of what trades is openly sold as a project.
The metros where distress language barely exists
The bottom of the index is just as striking, because the floor is literally zero.
| Metro | Closed sales | With descriptions | Distress share |
|---|---|---|---|
| New York City, NY | 1,158 | 1,158 | 0.00% |
| St. Augustine, FL | 2,674 | 2,674 | 0.00% |
| Port St. Lucie, FL | 1,764 | 1,764 | 0.00% |
| St Cloud, FL | 1,431 | 1,419 | 0.00% |
| St. Johns, FL | 1,176 | 1,176 | 0.00% |
| Lavon, TX | 778 | 758 | 0.00% |
| Valencia, CA | 710 | 704 | 0.00% |
| Green Twp, OH | 611 | 611 | 0.00% |
| Broadlands, VA | 562 | 562 | 0.00% |
| Colonie, NY | 502 | 502 | 0.00% |
A zero here does not mean a market contains no distressed homes. It means the words never appear, and that can reflect marketing culture as much as physical condition. In high-demand markets, sellers renovate before listing or agents avoid language that invites a discount. Distress language is a signal of what agents choose to say, and its absence is a weaker signal than its presence. This is the same reason we argue that valuation models need condition signals beyond the listing text, a problem we covered in the condition blind spot in automated valuations.
How investors can read this
For deal sourcing, the index is a density map. An investor working Camden or Jackson is fishing in water where roughly one listing in four or five self-identifies as a project in its own description. An investor working St. Augustine would read thousands of descriptions before finding one.
The language also does real pricing work. A listing that says as-is is telling you the seller has already conceded the gap between current condition and repaired value, which is exactly the spread an investor underwrites. If that framing is new to you, start with as-is value versus ARV, then pressure-test any candidate deal against the 70 percent rule before you trust the discount implied by the wording.
The practical takeaway is not that high-index metros are automatically good markets. It is that the index tells you where distressed product is a routine, visible part of what trades, and where finding it will require digging that listing text will not do for you. To see what investors turned that product into, pair this index with house flipping margins by city and the renovation premium study.
What this index is not
We want to be precise about the claim, because this metric is easy to over-read.
- •It is not foreclosure data. We count language in listing descriptions, not filings, auctions or REO inventory. A metro can rank high here with a quiet foreclosure pipeline, and vice versa.
- •It measures closed sales with descriptions. Properties sold off-market, or listed without usable text, are not counted. The share is language per described closed sale, nothing more.
- •Absence of language is not absence of distress. Agents write for buyers, not for researchers.
- •Metro definitions follow our data. Some entries are townships or satellite cities rather than broad metropolitan areas, because that is how the underlying records identify them.
Methodology
The Distress Language Index is built from Resideline's national sold corpus: 4,907,807 closed sales scanned across a 365-day window, covering sales closed after August 14, 2025. The corpus spans 2,235 metros, each with a minimum of 400 closed sales in the window.
For this study, a metro also needed at least 300 closed sales with usable listing descriptions, and 1,706 metros qualified. Each metro's score is the percentage of its described closed sales whose text matched our distress phrase list: as-is, cash only, investor special, needs work, handyman, fixer, TLC and similar constructions.
Wherever we aggregate across metros, figures are medians, not means, so the national 3.21 percent is the median metro share and is not pulled around by extreme markets. Metro coverage varies with our data density, so smaller markets appear only where our records are deep enough to clear the sample thresholds.
Resideline runs this same closed-sale corpus behind its valuation and analysis tools, so you can put any address, distressed or not, through the numbers at our free tools.
Frequently Asked Questions
What counts as distress language in this study?
We flagged listing descriptions containing phrases agents use to signal condition or sale constraints: as-is, cash only, investor special, needs work, handyman, fixer, TLC and similar wording. A listing counts once if its text matches any phrase on the list.
Is this the same as foreclosure data?
No. The index counts language in the listing descriptions of closed sales, not foreclosure filings, auctions or REO inventory. A metro can rank high on distress language while having few formal foreclosures, and the reverse is also possible.
Does a 0 percent share mean a market has no distressed homes?
No. It means the phrases never appeared in that metro's closed-sale descriptions during our window. Marketing culture matters: in high-demand markets sellers often renovate before listing, or agents avoid language that invites a discount, so absence of the words is a weaker signal than their presence.
Where is distress language most common?
Camden, NJ leads at 23.27 percent of described closed sales, followed by Jackson, MS at 21.64 percent and Pekin, IL at 19.52 percent, against a national median of 3.21 percent across 1,706 qualifying metros. Nine of the top fifteen metros are in Illinois.
How can investors use the Distress Language Index?
Treat it as a deal-sourcing density map. High-index metros are markets where a large share of what actually sells is openly marketed as a project, so listing text alone surfaces candidates. In low-index metros, finding distressed product requires sourcing beyond listing descriptions.

About the author
Jeffrey Batista
Jeffrey Batista is the founder of Resideline, a real estate technology company building institutional grade valuation and investment analysis tools for real estate investors.
A software engineer with more than 10 years of experience, Jeffrey has worked across full stack development, infrastructure, data engineering, machine learning, and large scale systems. He left his engineering career to build Resideline full time.
Jeffrey is also a real estate investor with nearly a decade of hands on experience buying, renovating, managing, and analyzing residential properties. His experience on both sides of the industry, as an engineer and an investor, led him to build Resideline after seeing how fragmented and outdated many of the tools available to individual investors were.
Today, he leads the development of Resideline's proprietary data infrastructure, automated valuation models, rental analytics, and investment underwriting technology.
Check the numbers behind your next renovation deal.
Create a free account to inspect sale comps, model repair costs and work through your maximum offer.
Create a free account3 free reports at signup. No card required.