The Renovation Premium: Where Renovated Homes Command the Largest Price Gap
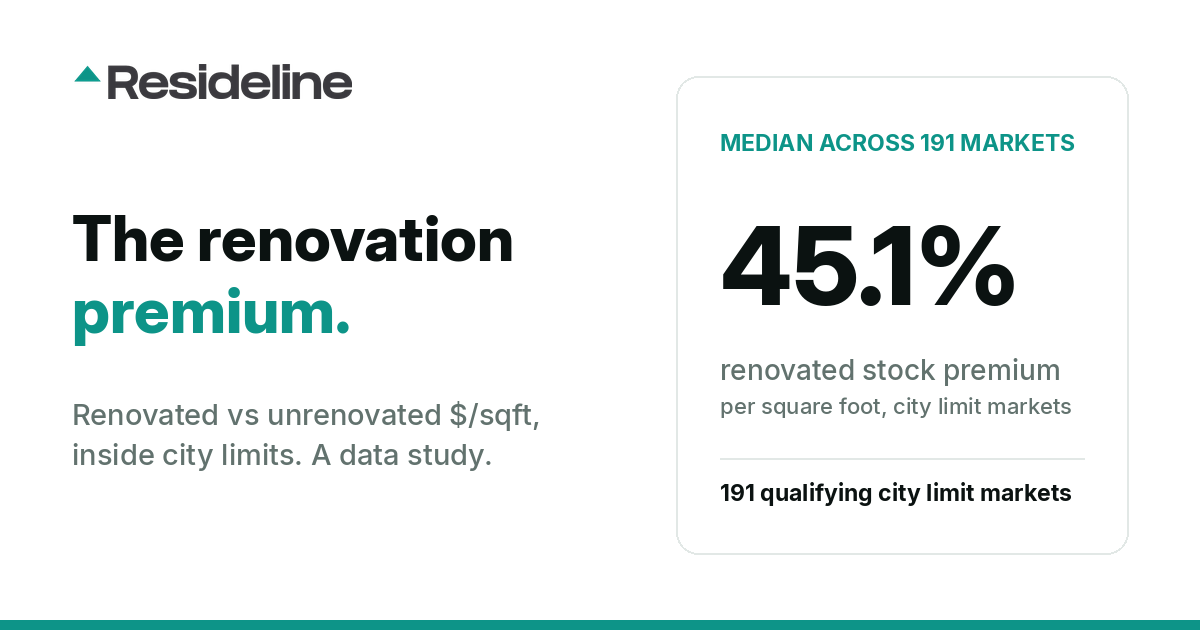
We measured the price gap between renovated and unrenovated homes across 1,784,956 closed sales inside the city limits of 1,674 U.S. cities. Across 191 qualifying city-limit markets, the median renovation premium is 45.1 percent; Pittsburgh leads at 264.9 percent, and the ranking changed once postal-city sampling was replaced with true municipal boundaries.
Across the markets we measured, renovated homes generally command a premium over fixer inventory. The question that matters is how much more, and where.
We measured it from closed sales, and this is the second edition of the answer. The first edition of this study selected each market by the postal city on the sale record, which quietly mixes municipalities: Birmingham mail covers Mountain Brook and Vestavia Hills, which are separate and far wealthier cities. This edition draws every city at its actual city limits, using the Census municipal boundary and each sale's own coordinates, and the ranking changed enough that we are publishing the correction rather than quietly editing numbers.
The headline
Across 1,784,956 closed sales inside the city limits of 1,674 U.S. cities over the 365 days ending August 22, 2026, we classified listings as renovated or unrenovated from their own descriptions and compared median price per square foot within each city. In the 191 qualifying city limit markets with at least 50 classified sales on each side, the median renovation premium is 45.1 percent.
That cross-market median is the boring part. The range is the story: from 264.9 percent in Pittsburgh to 0.3 percent in Des Plaines, Illinois.
Where the gap is widest
| Rank | City | Premium | Renovated $/sqft | Unrenovated $/sqft | Sample (reno / unreno) |
|---|---|---|---|---|---|
| 1 | Pittsburgh, PA | 264.9% | $184.82 | $50.65 | 892 / 143 |
| 2 | Birmingham, AL | 241.1% | $146.85 | $43.05 | 637 / 188 |
| 3 | Flint, MI | 217.9% | $71.56 | $22.51 | 208 / 100 |
| 4 | Springfield, OH | 217.2% | $138.89 | $43.78 | 255 / 51 |
| 5 | New Orleans, LA | 202.0% | $226.92 | $75.13 | 1,059 / 164 |
| 6 | Macon, GA | 201.2% | $120.48 | $40.00 | 449 / 158 |
| 7 | Anderson, IN | 171.4% | $112.12 | $41.31 | 207 / 78 |
| 8 | Jackson, MS | 171.1% | $107.34 | $39.60 | 283 / 170 |
| 9 | Rochester, NY | 167.0% | $123.46 | $46.24 | 669 / 120 |
| 10 | Shreveport, LA | 162.1% | $119.11 | $45.45 | 561 / 97 |
| 11 | Gary, IN | 159.3% | $103.17 | $39.79 | 275 / 134 |
| 12 | Dayton, OH | 158.3% | $120.83 | $46.78 | 617 / 199 |
| 13 | Toledo, OH | 154.1% | $120.55 | $47.45 | 1,082 / 182 |
| 14 | Danville, VA | 148.5% | $127.86 | $51.46 | 110 / 62 |
| 15 | St. Louis, MO | 148.1% | $170.75 | $68.82 | 1,127 / 392 |
The pattern behind the whole table is the same one the first edition found: legacy industrial cities with old housing stock, where an unrenovated house can trade near land value while finished stock sells at three to four times its price per square foot.
Where renovating barely registers
| City | Premium | Sample (reno / unreno) |
|---|---|---|
| Des Plaines, IL | 0.3% | 166 / 54 |
| Riverside, CA | 4.2% | 781 / 61 |
| Arlington, VA | 4.5% | 1,021 / 89 |
| Austin, TX | 4.7% | 774 / 59 |
| Raleigh, NC | 7.0% | 1,650 / 117 |
Read the number for what it is
A 200 percent gap is not the return on renovating a normal house. It is the spread between distressed, often gutted stock and finished stock. The unrenovated side of these medians is dominated by houses described with words like as-is, handyman, and cash only. If you buy a sound house and remodel the kitchen, your outcome lives nowhere near these numbers. What the spread does measure is the repricing power of condition in each market, which is exactly what a flipper or a lender underwriting a rehab loan needs to compare across cities.
What changed from the first edition, precisely
Three things, all disclosed: the geography (Census city-limits polygons instead of postal city names; postal sampling mixed municipalities and both inflated and compressed premiums depending on the suburb mix), the qualification rule (at least 50 classified sales in each bucket, which is what the first edition's tables actually exhibited; a looser reading produces degenerate entries built on single-sale buckets), and the window (365 days ending August 22, 2026). The first edition's median of 36.5 percent across 215 postal-name markets becomes 45.1 percent across 191 city limit markets, and eight of the first edition's top ten remain in this edition's top ten.
Methodology
Closed sales from the Resideline corpus, 365 days ending August 22, 2026, filtered to each city's Census municipal boundary by per-sale coordinates. Renovation status is classified from listing descriptions (renovated, remodeled, updated throughout, versus as-is, fixer, needs work, handyman and similar; ambiguous listings are excluded rather than guessed). Price per square foot uses living area only, with sanity bounds on size and price. A city qualifies with at least 400 in-boundary closings, at least 300 usable descriptions, and at least 50 classified sales in each bucket. Premium = median renovated $/sqft over median unrenovated $/sqft, minus one. Medians, never means, so single trophy sales cannot move a city's number.
Frequently Asked Questions
How much more do renovated homes sell for?
Across 191 qualifying U.S. city-limit markets, the median gap between renovated and unrenovated price per square foot is 45.1 percent, measured from 1,784,956 closed sales inside city limits over the 365 days ending August 22, 2026. The range runs from about 265 percent in Pittsburgh to under 1 percent in Des Plaines, IL.
Which city has the highest renovation premium?
Pittsburgh, PA. Renovated homes there sold for a median $184.82 per square foot against $50.65 for unrenovated stock, a 264.9 percent gap across 1,035 classified closings inside the city limits. Birmingham, AL is second at 241.1 percent.
Is the renovation premium the ROI of renovating?
No. The gap measures distressed-versus-finished stock, not the return on remodeling a livable house. The unrenovated bucket is dominated by as-is and fixer listings, some near land value. Treat the premium as each market's repricing power of condition, which is what flippers and rehab lenders need to compare across cities.
Why did the numbers change from the first edition of this study?
The first edition selected markets by postal city, which mixes municipalities (Birmingham's mail covers Mountain Brook and Vestavia Hills). This edition uses Census city-limits boundaries and per-sale coordinates, plus a per-bucket sample floor. The median across qualifying city-limit markets moved from 36.5 to 45.1 percent and Pittsburgh replaced Birmingham at the top; eight of the old top ten remain in the new top ten.

About the author
Jeffrey Batista
Jeffrey Batista is the founder of Resideline, a real estate technology company building institutional grade valuation and investment analysis tools for real estate investors.
A software engineer with more than 10 years of experience, Jeffrey has worked across full stack development, infrastructure, data engineering, machine learning, and large scale systems. He left his engineering career to build Resideline full time.
Jeffrey is also a real estate investor with nearly a decade of hands on experience buying, renovating, managing, and analyzing residential properties. His experience on both sides of the industry, as an engineer and an investor, led him to build Resideline after seeing how fragmented and outdated many of the tools available to individual investors were.
Today, he leads the development of Resideline's proprietary data infrastructure, automated valuation models, rental analytics, and investment underwriting technology.
Check the numbers behind your next renovation deal.
Create a free account to inspect sale comps, model repair costs and work through your maximum offer.
Create a free account3 free reports at signup. No card required.