Is It a Buyer's Market Right Now? Price Cuts and Days to Sell (2026)
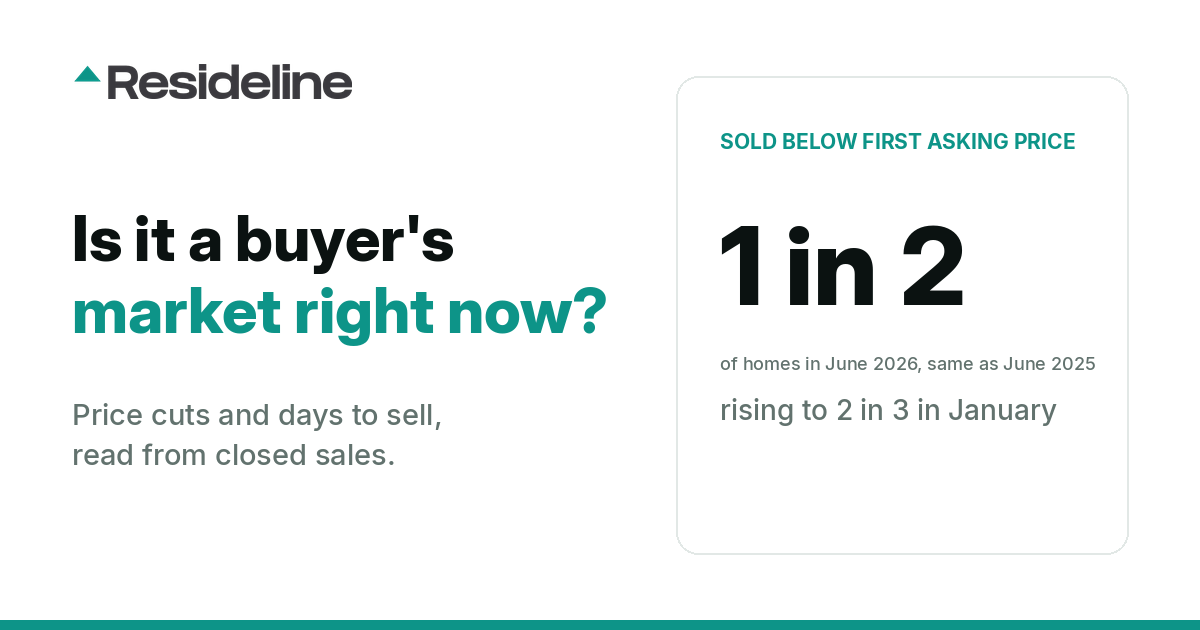
More than half of homes sell below their original asking price, but that is not new: it was just as true a year ago. What changes is the season, and the state. Here is what closed sales show about negotiating room in 2026.
Prices are a lagging signal. The balance of power between buyers and sellers shows up first in negotiation: how far below the asking price a home finally sells, and how long it takes to find a buyer. So we measured both, and the answer is less dramatic than the headlines.
Among the closings in our data where the complete asking-price history is on record, 52.8 percent sold below their original asking price in June 2026. In June 2025 the figure was 53.0 percent. By that measure, this summer looks like last summer: most sellers end up below their first price, and they did a year ago too. What changed in between was the season.
The negotiation gap, month by month
The share selling below the original asking price climbed through the autumn to a peak of 67.3 percent in January 2026, then fell back through the spring to where it started. Time on the market moved with it. The typical home went under contract 16 days after listing in June 2025 and 16 days after listing in June 2026, but in January it took 34 days to find a buyer and 84 days to reach closing.
| Month | Sold below original ask | Sold below final ask | Days to contract | Days to close |
|---|---|---|---|---|
| June 2025 | 53.0% | 39.8% | 16 | 59 |
| September 2025 | 61.3% | 45.7% | 22 | 66 |
| January 2026 | 67.3% | 50.6% | 34 | 84 |
| April 2026 | 55.9% | 41.6% | 20 | 61 |
| June 2026 | 52.8% | 39.6% | 16 | 59 |
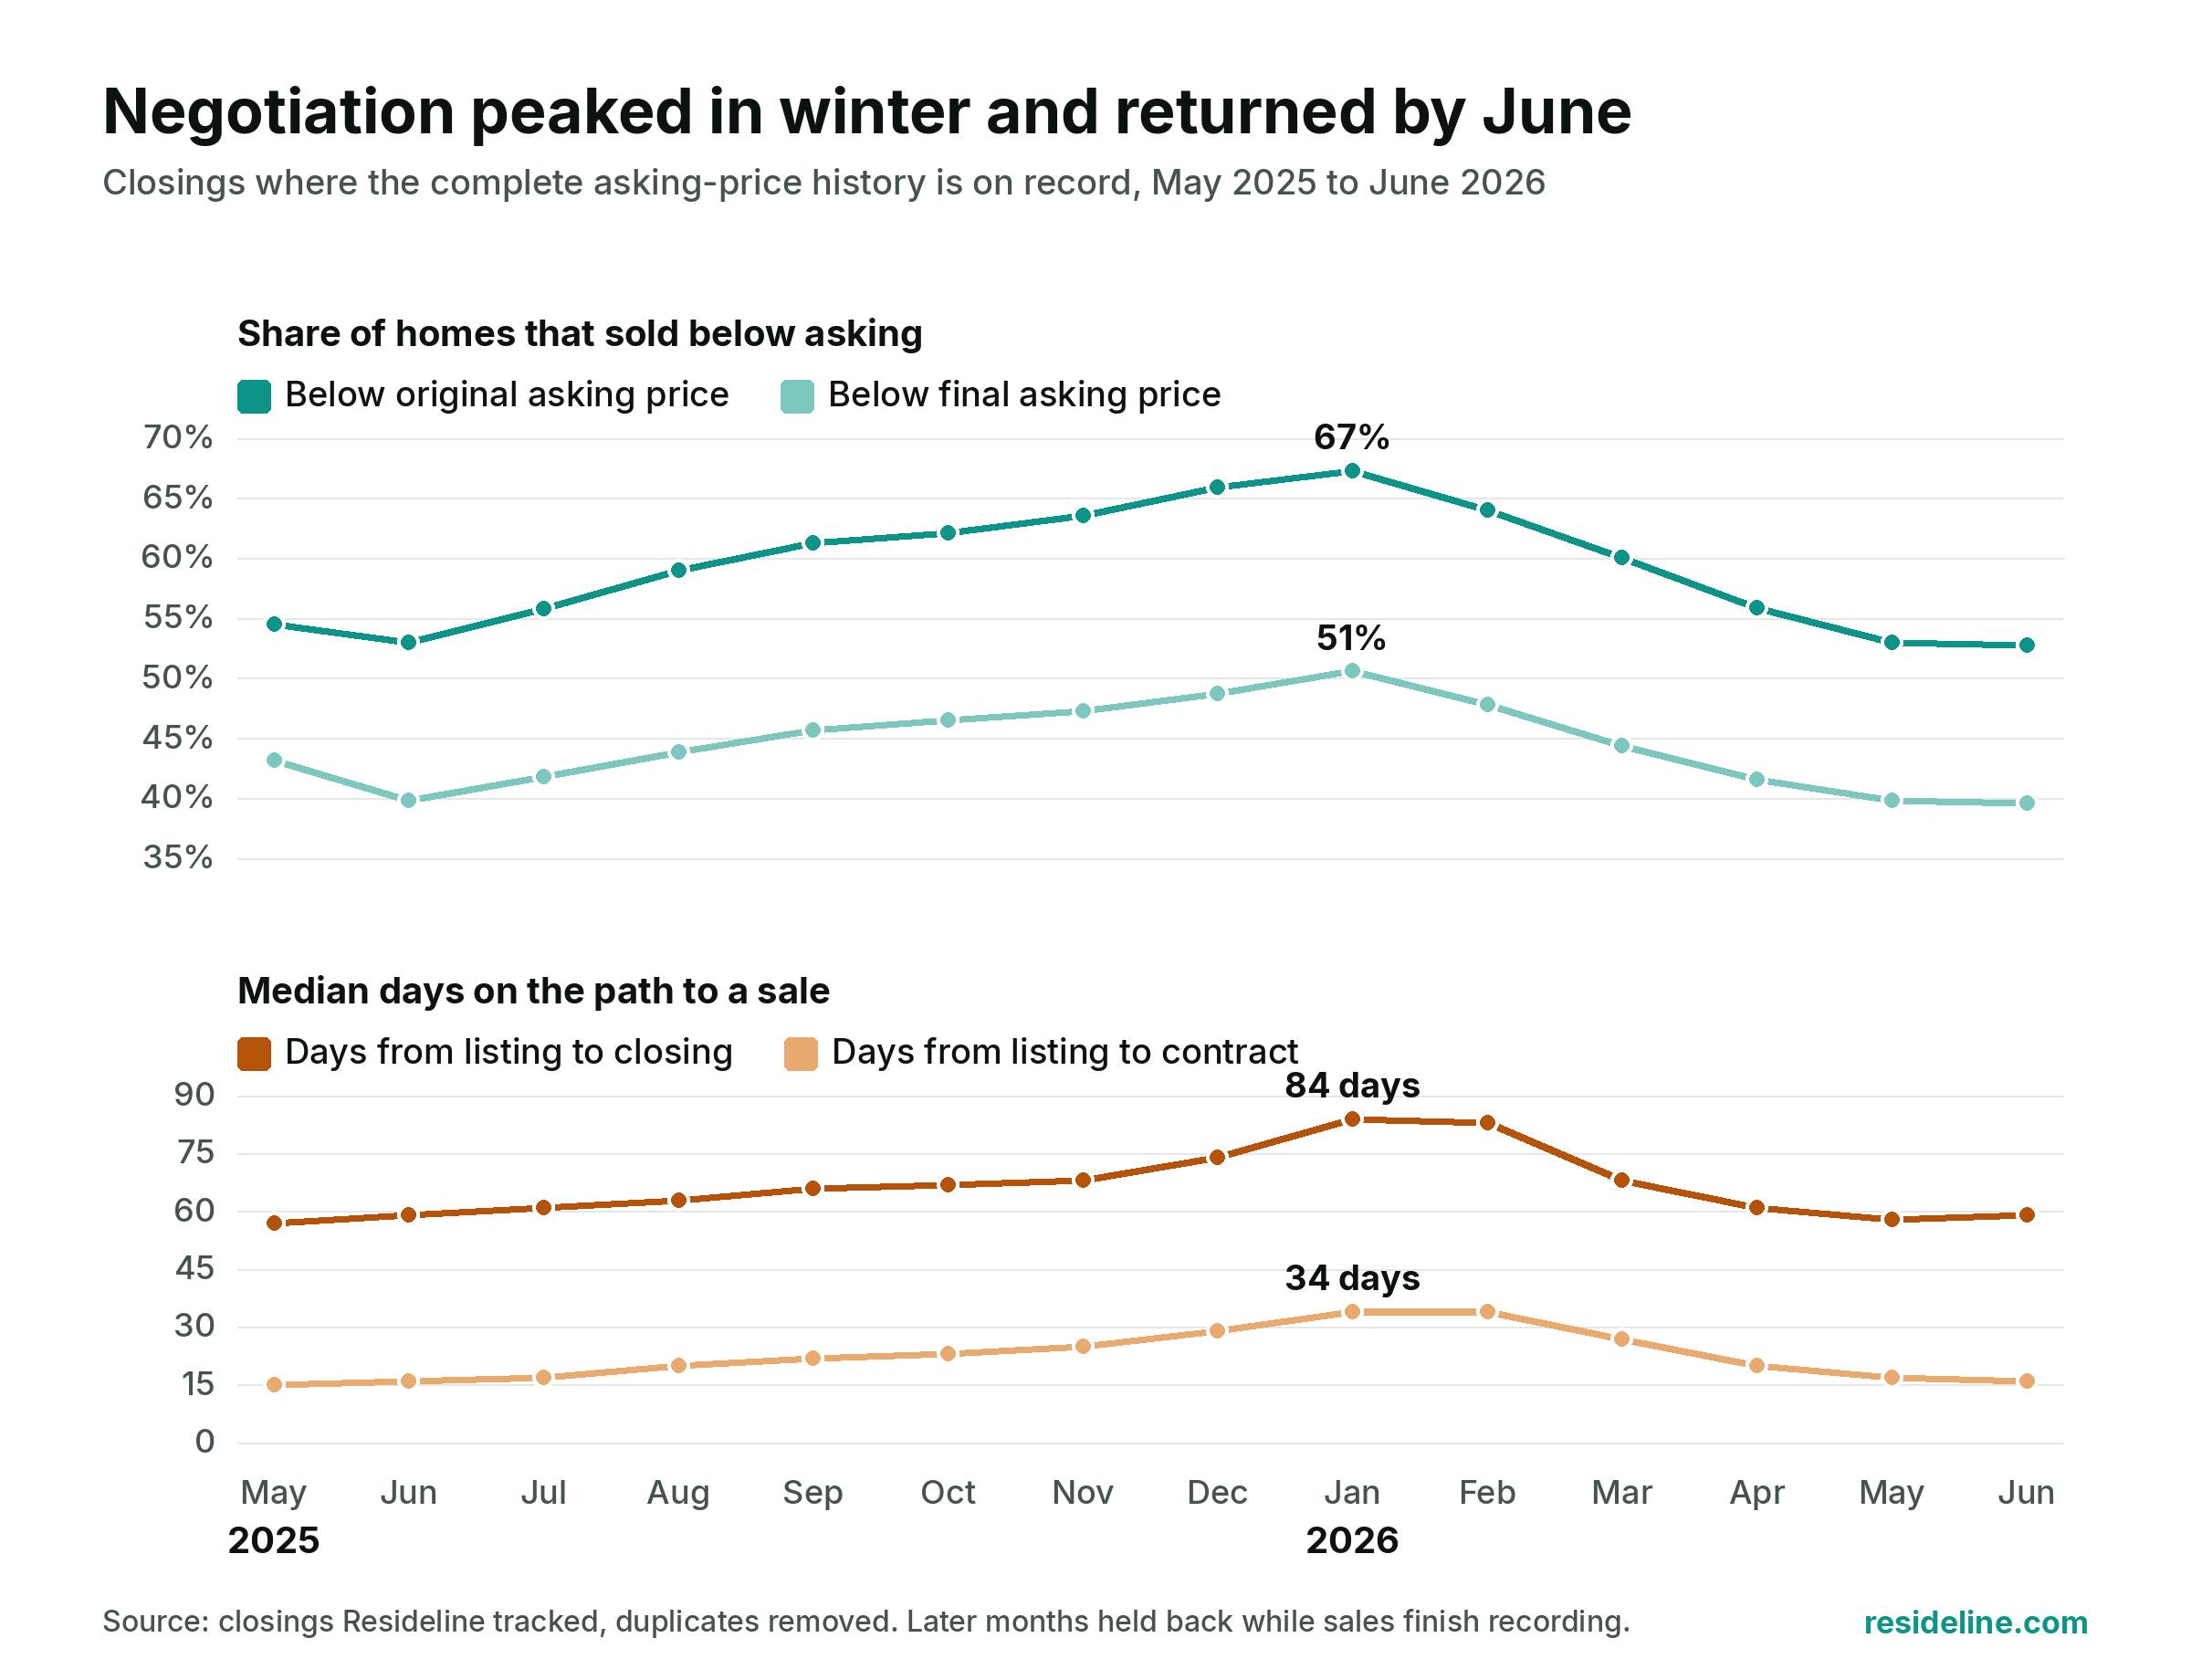
Two measures are worth keeping apart. Selling below the original asking price mostly reflects price cuts made while the home was listed: measured against the final asking price, after any cuts, 39.6 percent sold below asking in June 2026, against 39.8 percent a year earlier. And the days to closing include the weeks between an accepted offer and the closing itself, so the days to contract are the better guide to how long a home takes to find a buyer.
Where buyers have the most room
Leverage is not spread evenly. Over the 12 months from July 2025 through June 2026, these six states had the highest share of homes selling below their original asking price, among states with at least 20,000 closings we can trace:
| State | Sold below original ask | Sold below final ask | Days to contract | Days to close |
|---|---|---|---|---|
| Florida | 81% | 68% | 45 | 89 |
| South Carolina | 75% | 60% | 35 | 83 |
| Arizona | 74% | 59% | 40 | 75 |
| Tennessee | 71% | 60% | 27 | 72 |
| North Carolina | 71% | 58% | 31 | 77 |
| Nevada | 70% | 55% | 26 | 66 |
| All states | 60% | 44% | 22 | 66 |
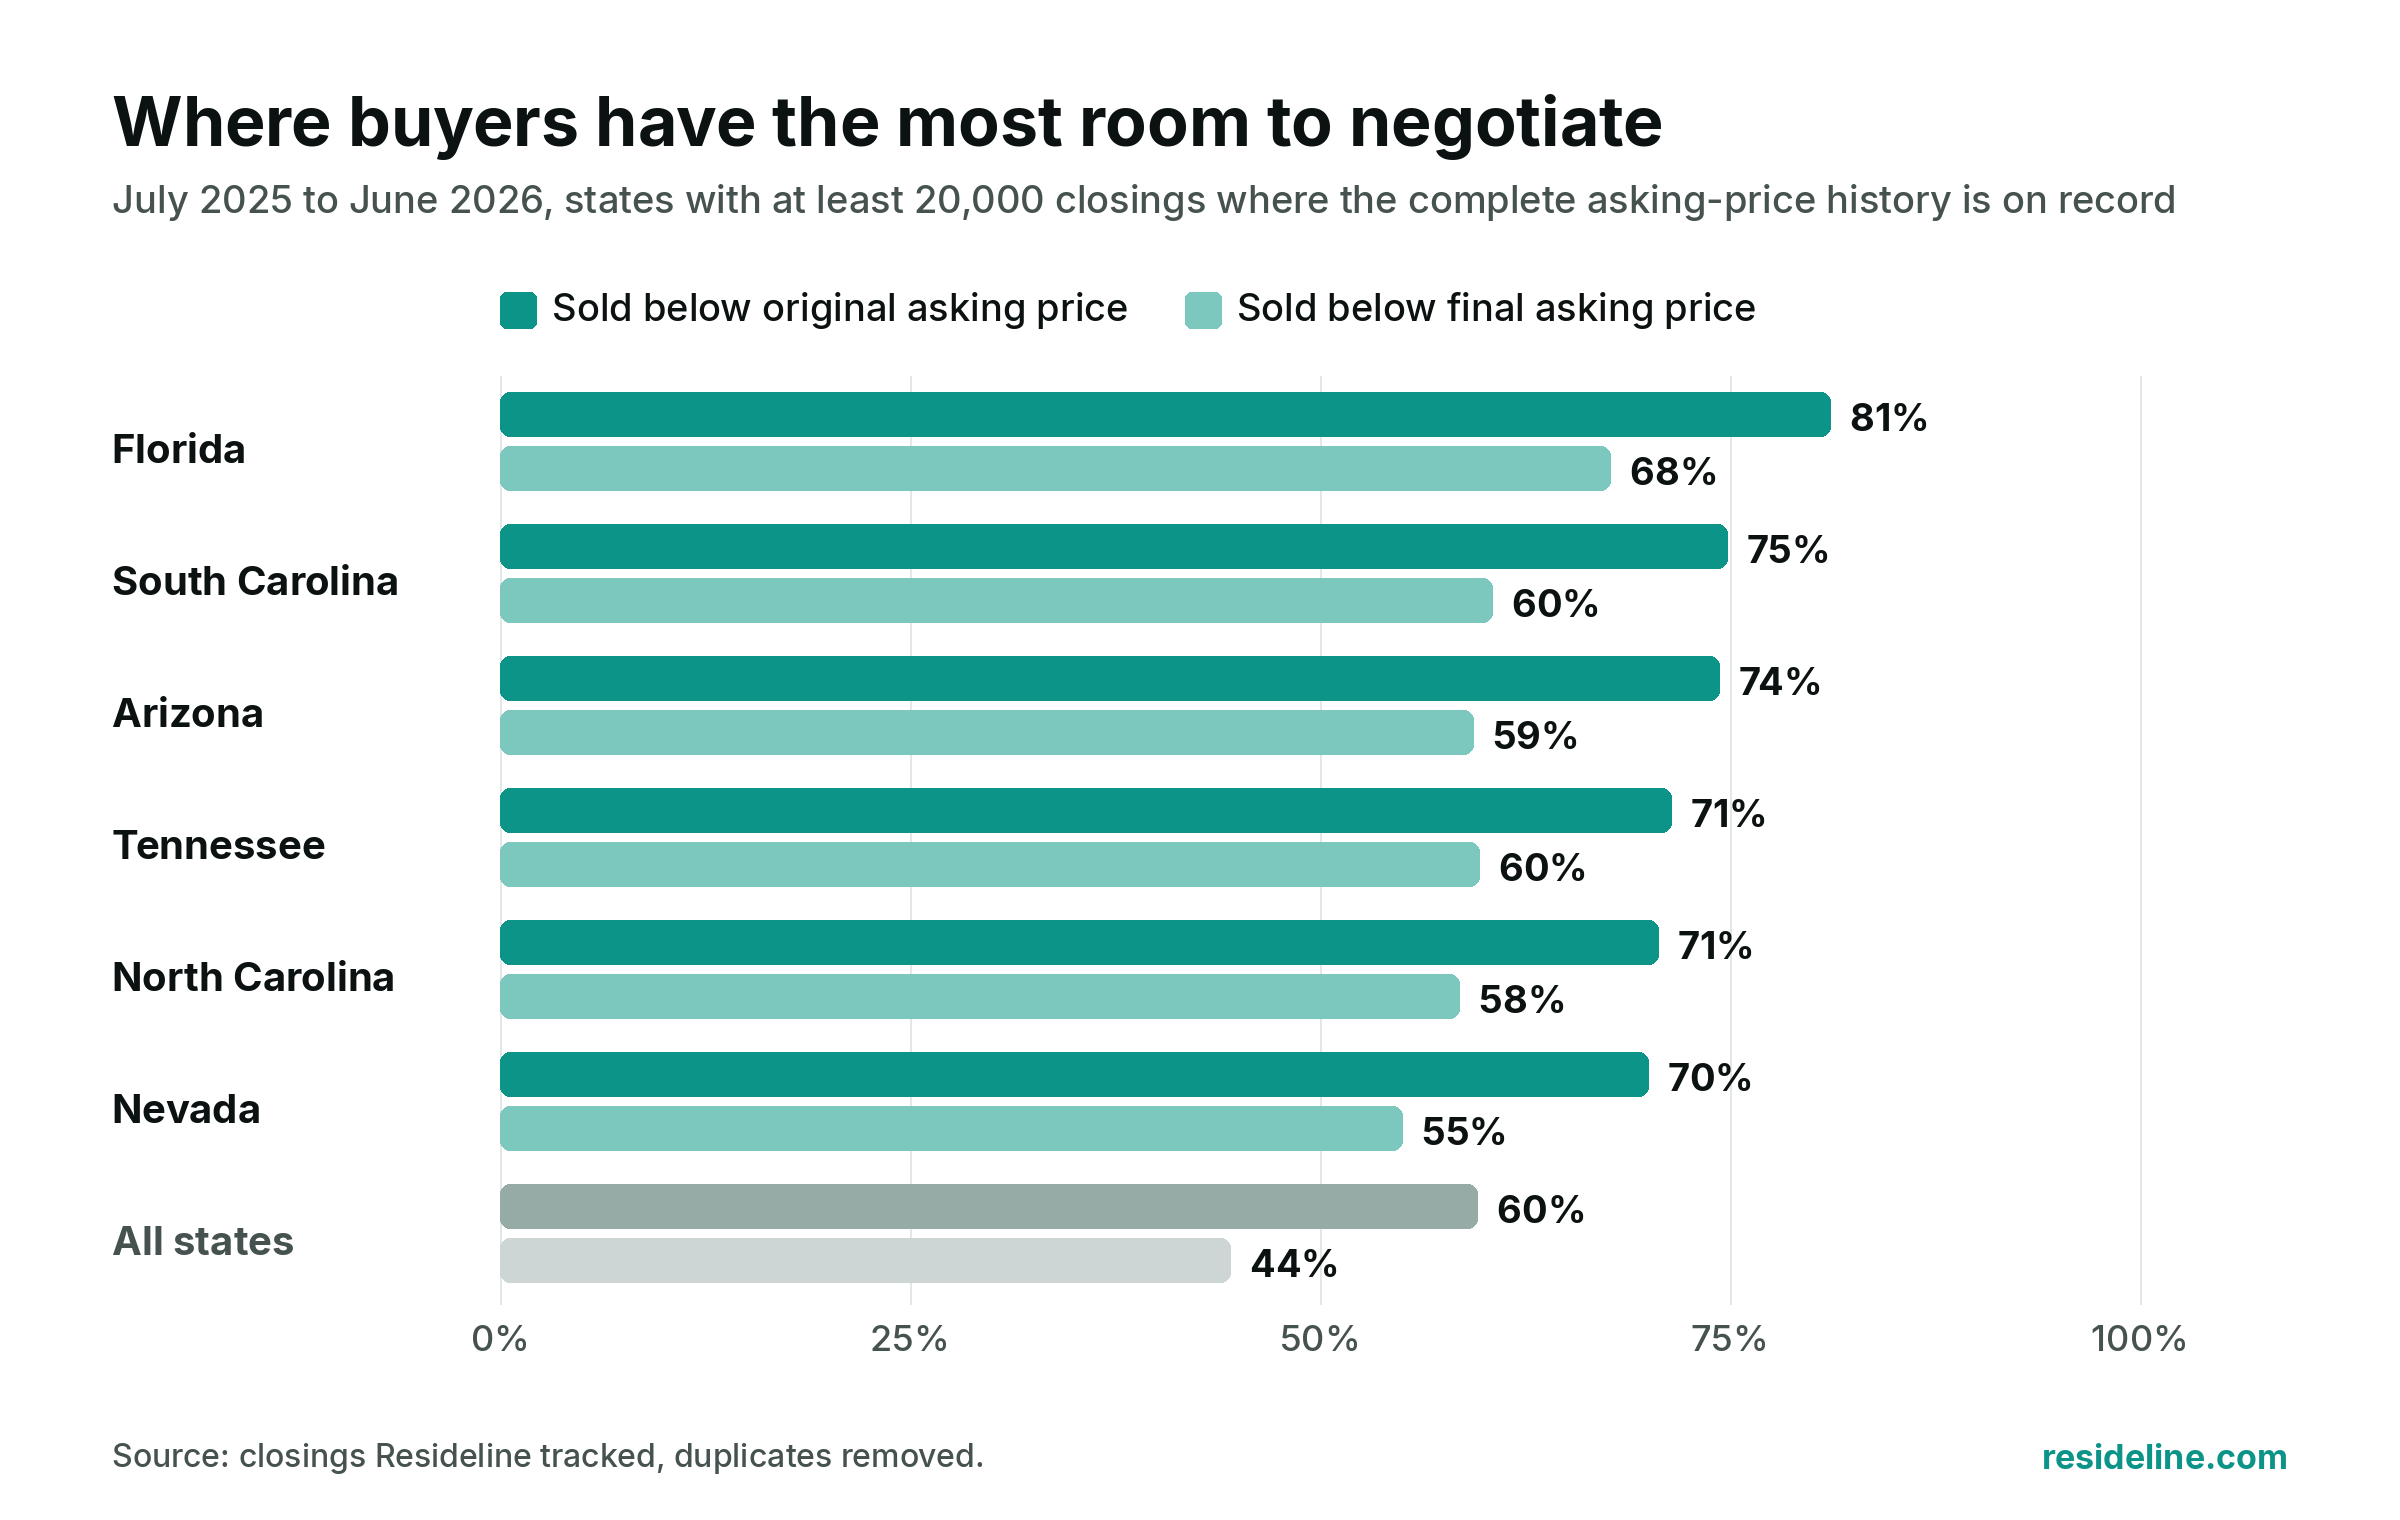
Florida stands out on every measure. Over those 12 months about 81 percent of the homes we can trace sold below their original asking price and 68 percent below their final asking price, the typical home took 45 days to go under contract, and Florida is one of the two states where same-home house prices fell by about 1 percent. In Tennessee and the Carolinas most homes also sold below asking, even though same-home house prices there still rose, by 1.1 to 2.2 percent. Negotiation and price do not have to move together. We rank prices by state in where home prices are falling.
It is not a buyer's market everywhere
The national picture hides plenty of markets that still favor sellers. In Wisconsin, New York, New Jersey and Massachusetts fewer than half of homes sold below their original asking price over the same 12 months, against about 60 percent across all states. In Ohio, Wisconsin and Massachusetts the typical home went under contract in about 9 to 10 days, against 22 days nationally, and same-home house prices in Wisconsin, New Jersey and Ohio are still rising about 4 to 6 percent a year. A buyer in Wisconsin faces a very different negotiation than one in Florida.
The wider data points the same way without screaming crash. The National Association of Realtors reported existing-home sales running near a 4.0 million annual pace in August 2026, pending sales down about 5 percent from a year earlier, and inventory at 4.9 months of supply, the highest in more than ten years according to NAR but still below the roughly six months generally considered a balanced market.
So, is it a buyer's market?
Not in the sense of a new trend: June 2026 looks like June 2025 on every measure we track. It is a market where most sellers end up below their first asking price, where buyers have the most room in winter and the least in early summer, and where the Sun Belt gives buyers far more room than the Northeast and much of the Midwest. The everyday friction is seasonal, and it is local.
The useful move is to read the specific market, not the national one. Pull the recent closed sales for the property you want, note how many sold below their final asking price and by how much, and let that set your offer. Our free tools show those closed comparable sales and the local trend for any address, and the ARV calculator helps if you are buying to renovate. For the national price picture, see is the housing market crashing.
How we measured this
- •Negotiation: single family closings from a consistent subset of listings where the full asking-price history is on record, 2,415,005 of them in the 12 months from July 2025 through June 2026. For each sale we compare the closing price with the original asking price and with the final asking price after any cuts, and measure the days from first listing to an accepted contract and to closing. State figures require at least 20,000 such closings.
- •Monthly figures run from May 2025 through June 2026. Sales from July through September 2026 are still being recorded, so we leave them out.
Sources
- •NAR existing-home sales, August 2026, September 10, 2026
- •NAR pending home sales, August 2026, September 17, 2026
- •NAR on months of supply and a balanced market
Updated September 30, 2026.
Frequently Asked Questions
Is it a buyer's market or a seller's market right now?
It depends on where you are and when you buy. Nationally, most homes sell below their original asking price, about 60 percent over the 12 months to June 2026, but that was just as true a year earlier. Florida, the Carolinas, Arizona, Tennessee and Nevada give buyers the most room, while much of the Northeast and Midwest still favors sellers, with homes going under contract in about 10 days.
What share of homes sell below asking price now?
In June 2026, 52.8 percent of the closings we can trace sold below their original asking price and 39.6 percent below their final asking price after any cuts, almost exactly the same as June 2025. The share is seasonal: below the original ask, it peaked at about two in three in January 2026.
How long are homes taking to sell in 2026?
In June 2026 the typical home went under contract 16 days after listing and closed 59 days after listing, the same as June 2025. At the January peak it took 34 days to find a buyer and 84 days to close. In Florida the typical home took about 45 days to go under contract over the 12 months to June 2026.
Should I offer below asking price?
Look at the final asking price, not the original. Nationally, about 40 to 45 percent of homes sell below their final asking price, and about two thirds do in Florida. Base your offer on how the recent closed sales for that specific property type and neighborhood compared with their final asking prices, not on a national average.
Is 2026 a good time to buy a house?
For negotiating room, the season matters more than the year: buyers had the most room in January 2026 and the least in early summer, and this summer looks like last summer. The trade-off is mortgage rates near 7 percent. Check whether your market is one where most homes sell below their final asking price before assuming you have leverage.
Does more negotiating room mean prices are about to crash?
Not by itself. Below-asking closings and longer winter sales are how a market cools without collapsing, and the June to June comparison shows no new shift. Inventory at 4.9 months of supply is the highest in more than a decade but still below the roughly six months generally considered a balanced market, and same-home house prices nationally are still slightly positive.

About the author
Jeffrey Batista
Jeffrey Batista is the founder of Resideline, a real estate technology company building institutional grade valuation and investment analysis tools for real estate investors.
A software engineer with more than 10 years of experience, Jeffrey has worked across full stack development, infrastructure, data engineering, machine learning, and large scale systems. He left his engineering career to build Resideline full time.
Jeffrey is also a real estate investor with nearly a decade of hands on experience buying, renovating, managing, and analyzing residential properties. His experience on both sides of the industry, as an engineer and an investor, led him to build Resideline after seeing how fragmented and outdated many of the tools available to individual investors were.
Today, he leads the development of Resideline's proprietary data infrastructure, automated valuation models, rental analytics, and investment underwriting technology.
Check the evidence behind your property’s value.
Create a free account to inspect comps and the assumptions behind your property’s estimated value.
Create a free account3 free reports at signup. No card required.