Where Flips Actually Happen and What They Gross: House Flipping Margins by City
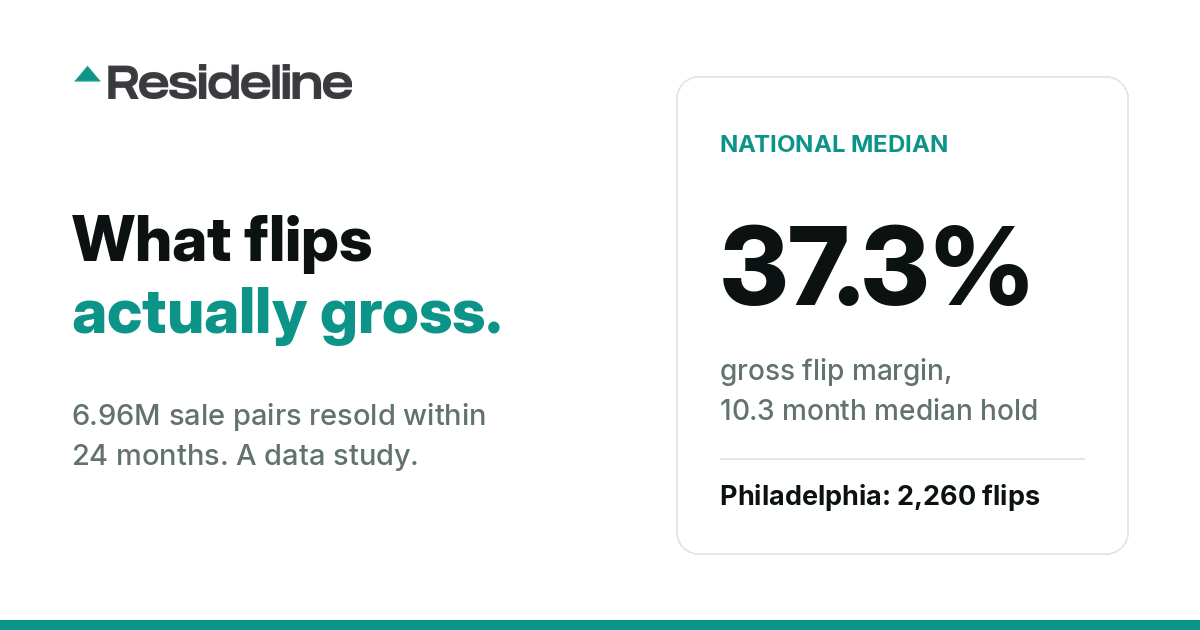
From 6.96 million sale pairs we isolated the flip signature, properties resold within 3 to 24 months at a higher price, and ranked US metros by flip volume and gross margin. The national median gross margin is 37.3 percent on a 10.3 month hold, and the spread between cities is enormous.
We took 6,963,756 sale pairs, every case in our records where the same property sold twice, and isolated the ones that carry the flip signature: purchased, then resold 3 to 24 months later at a higher price, with the resale closing in 2023 or later. That filter surfaced flip activity in 656 US metros, and 378 of them had enough volume for us to publish reliable medians.
Two headline numbers frame everything below. The national median gross margin is 37.3 percent, and the median hold is 10.3 months between purchase and resale.
What counts as a flip, and what gross means
Before the rankings, two definitions matter.
First, the flip signature. We require a resale 3 to 24 months after purchase, at a higher price, closing in 2023 or later. This catches classic renovation flips, but it also catches wholetail deals and teardown-rebuilds, and it excludes flips that sold at a loss, since we require a higher resale price.
Second, and more important: gross margin is the resale price over the purchase price. It does not subtract renovation costs, financing costs, holding costs, or selling costs. A 37.3 percent gross margin is not a 37.3 percent profit. On a real project, the rehab budget, lender interest, and commissions all come out of that number, and they routinely consume most of it. We wrote a full breakdown of what flipping actually costs, and every figure in this article should be read with that math in mind.
The cities with the most flips
Ranked by the number of qualifying flips, here are the 15 highest-volume metros in our data.
| Rank | Metro | Flips | Median gross margin | Median hold |
|---|---|---|---|---|
| 1 | Las Vegas, NV | 3,662 | 28.5% | 8.2 mo |
| 2 | Cleveland, OH | 2,461 | 73.2% | 9.6 mo |
| 3 | Jacksonville, FL | 2,311 | 53.1% | 8.4 mo |
| 4 | Philadelphia, PA | 2,260 | 105.0% | 9.8 mo |
| 5 | Phoenix, AZ | 2,160 | 38.2% | 8.0 mo |
| 6 | Detroit, MI | 1,937 | 101.1% | 9.7 mo |
| 7 | Indianapolis, IN | 1,899 | 58.0% | 8.6 mo |
| 8 | Tucson, AZ | 1,889 | 39.3% | 8.7 mo |
| 9 | Minneapolis, MN | 1,742 | 39.3% | 9.4 mo |
| 10 | Cincinnati, OH | 1,731 | 59.1% | 9.2 mo |
| 11 | Chicago, IL | 1,711 | 80.6% | 12.1 mo |
| 12 | Los Angeles, CA | 1,692 | 44.6% | 10.2 mo |
| 13 | Atlanta, GA | 1,670 | 40.5% | 11.6 mo |
| 14 | Miami, FL | 1,591 | 35.8% | 11.9 mo |
| 15 | Baltimore, MD | 1,555 | 99.3% | 9.4 mo |
Holds in the top 15 are fast everywhere, ranging from 8.0 months in Phoenix to 12.1 months in Chicago.
Where gross margins run highest
Among the 378 qualifying metros, these 15 posted the highest median gross margins.
| Rank | Metro | Flips | Median gross margin | Median hold |
|---|---|---|---|---|
| 1 | Bethesda, MD | 161 | 124.0% | 13.9 mo |
| 2 | Philadelphia, PA | 2,260 | 105.0% | 9.8 mo |
| 3 | Detroit, MI | 1,937 | 101.1% | 9.7 mo |
| 4 | Baltimore, MD | 1,555 | 99.3% | 9.4 mo |
| 5 | Gwynn Oak, MD | 159 | 89.4% | 7.2 mo |
| 6 | Bedford, OH | 177 | 88.9% | 9.4 mo |
| 7 | Pittsburgh, PA | 709 | 88.2% | 10.5 mo |
| 8 | Camden, NJ | 163 | 88.1% | 9.2 mo |
| 9 | South Bend, IN | 337 | 83.8% | 10.5 mo |
| 10 | Center Point, AL | 287 | 80.7% | 8.1 mo |
| 11 | Chicago, IL | 1,711 | 80.6% | 12.1 mo |
| 12 | Petersburg, VA | 216 | 76.7% | 10.6 mo |
| 13 | Buffalo, NY | 892 | 76.0% | 10.0 mo |
| 14 | Macon, GA | 460 | 73.6% | 9.7 mo |
| 15 | Redford, MI | 179 | 73.3% | 7.6 mo |
One caution on the top of this list. Bethesda, MD grosses 124.0 percent on 161 flips, but it also carries the longest hold in the table at 13.9 months, and it is an expensive market. In high-priced metros, a purchase followed by a much larger resale within two years often reflects a teardown-rebuild, not a cosmetic flip. The gross margin is real, but the capital and construction behind it are in a different league, so read high-priced entries on this list as a mix of flip strategies, not one.
Where margins are thinnest
The bottom of the distribution is just as instructive. These are the 10 thinnest-margin metros among those with enough flips to qualify.
| Rank | Metro | Flips | Median gross margin | Median hold |
|---|---|---|---|---|
| 1 | Fort Mill, SC | 228 | 7.4% | 14.1 mo |
| 2 | Castle Rock, CO | 186 | 7.5% | 13.8 mo |
| 3 | Clermont, FL | 173 | 9.8% | 13.9 mo |
| 4 | Gulf Shores, AL | 154 | 9.8% | 16.9 mo |
| 5 | Queen Creek, AZ | 360 | 9.9% | 10.7 mo |
| 6 | Ankeny, IA | 154 | 9.9% | 16.6 mo |
| 7 | Surprise, AZ | 254 | 10.1% | 10.7 mo |
| 8 | Edmond, OK | 429 | 10.1% | 13.9 mo |
| 9 | Wake Forest, NC | 163 | 10.8% | 13.4 mo |
| 10 | Yukon, OK | 257 | 11.1% | 12.6 mo |
Reading the spread
The gap between the top and bottom of the margin table is 116.6 percentage points, Bethesda at 124.0 percent versus Fort Mill at 7.4 percent. A few things explain a spread that wide.
- •Margin lives in the purchase discount. The metros grossing 70 percent and up are dominated by older, lower-priced housing stock where deeply distressed properties trade far below their renovated value. That spread is exactly what our renovation premium study measures, and the distress language index shows where that discounted product comes to market. Newer suburbs simply do not offer that entry discount.
- •High-margin metros also move faster. Most of the top-margin list holds under 10.6 months, and Gwynn Oak turns in 7.2 months. The thin-margin list holds 10.7 to 16.9 months for far less gross.
- •The discipline changes by market. In a 105 percent gross market like Philadelphia, standard acquisition math like the 70 percent rule leaves real cushion. In a 7 to 11 percent gross market, the same formula will reject almost every deal, and it is probably right to.
Methodology
This study is built from our property records corpus: 6,040,171 property records scanned, yielding 6,963,756 sale pairs where the same property sold at least twice.
A flip is defined as a resale 3 to 24 months after purchase, at a higher price, with the resale closing in 2023 or later. We capped gross margins at 300 percent to screen out data errors and non-market transfers. That signature appeared in 656 metros, and 378 metros had enough qualifying flips to publish medians. The smallest sample shown in this article is 154 flips.
All figures are medians, half of flips in each metro did better and half did worse, and margins are gross, resale over purchase, before any costs. Metro coverage varies with our data density, so markets where our records are thinner may be underrepresented, and metro labels follow the city field in our records, which is why some entries are large suburbs rather than core cities. Figures were generated on August 14, 2026.
If you want to run acquisition numbers on a specific property rather than a metro, Resideline analyzes any address with the same sale-pair data behind this study.
Frequently Asked Questions
What is the median house flipping profit margin?
Across 378 qualifying US metros in our study of 6.96 million sale pairs, the national median gross margin is 37.3 percent on a median hold of 10.3 months. That figure is gross, resale price over purchase price, and does not subtract renovation, financing, or selling costs.
Which city has the most house flips?
Las Vegas, NV leads our data on volume with 3,662 qualifying flips, at a 28.5 percent median gross margin and an 8.2 month median hold. Cleveland, OH is second at 2,461 flips and Jacksonville, FL third at 2,311.
Which cities have the highest flip profit margins?
Bethesda, MD tops the margin ranking at a 124.0 percent median gross on 161 flips, though high-priced metros like Bethesda often reflect teardown-rebuilds rather than cosmetic flips. Among high-volume metros, Philadelphia leads at 105.0 percent on 2,260 flips, followed by Detroit at 101.1 percent on 1,937 flips.
How long does a typical house flip take?
The national median hold between purchase and resale is 10.3 months. High-margin metros tend to move faster, Gwynn Oak, MD turns in 7.2 months, while every metro on our thinnest-margin list held longer than the national median, up to 16.9 months in Gulf Shores, AL.

About the author
Jeffrey Batista
Jeffrey Batista is the founder of Resideline, a real estate technology company building institutional grade valuation and investment analysis tools for real estate investors.
A software engineer with more than 10 years of experience, Jeffrey has worked across full stack development, infrastructure, data engineering, machine learning, and large scale systems. He left his engineering career to build Resideline full time.
Jeffrey is also a real estate investor with nearly a decade of hands on experience buying, renovating, managing, and analyzing residential properties. His experience on both sides of the industry, as an engineer and an investor, led him to build Resideline after seeing how fragmented and outdated many of the tools available to individual investors were.
Today, he leads the development of Resideline's proprietary data infrastructure, automated valuation models, rental analytics, and investment underwriting technology.
Check the numbers behind your next renovation deal.
Create a free account to inspect sale comps, model repair costs and work through your maximum offer.
Create a free account3 free reports at signup. No card required.