Best Places to Buy Rental Property in Minnesota (2026)
Twenty Minnesota cities ranked by asking rental yield, from 8.3 percent in Brooklyn Park to 6.7 percent in Saint Louis Park, using tracked home sales and rental listings; geographic coverage explained below.
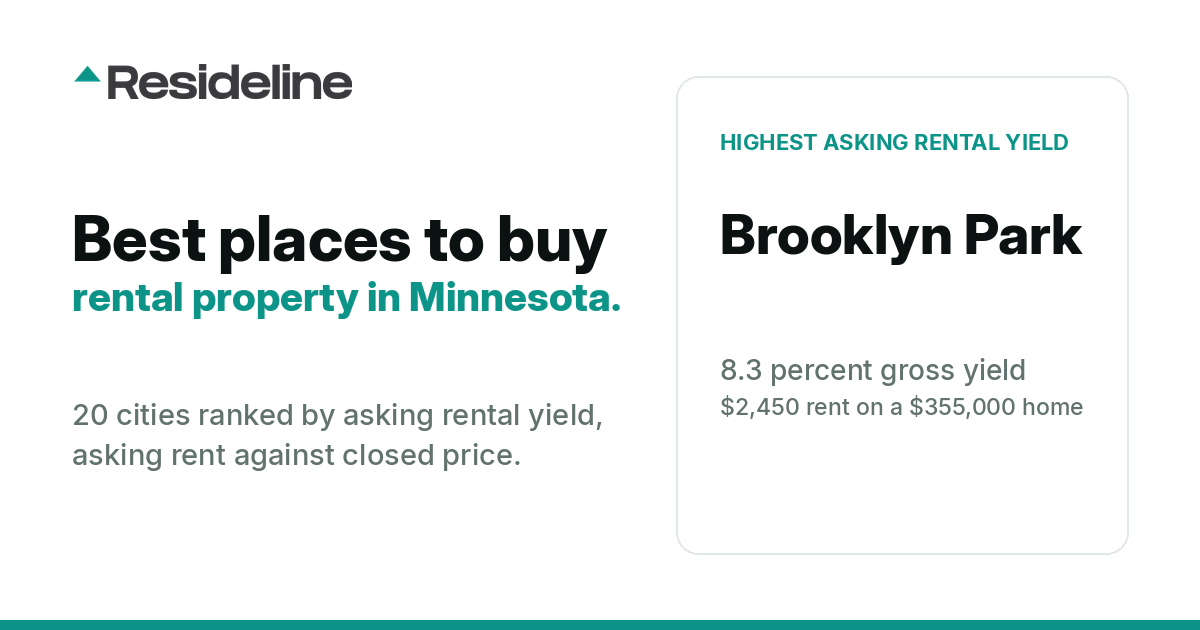
Minnesota shows a 1.6-point spread in gross asking rental yield, from 6.7 percent in Saint Louis Park to 8.3 percent in Brooklyn Park. Read the ratio as a screen and weigh it with purchase price, expenses and demand before ranking any of these markets against another. Crystal is close behind at 8.1 percent. Maple Grove, the busiest market on the list with about 118 closings a month, sits tenth of 20 at 7.1 percent. The table shows the 20 highest-yielding markets among 54 Minnesota cities meeting the coverage requirements; the yield range above describes the markets shown. A second table lists one city with enough closings to price but too few rental listings to rank.
The ranking
| # | City | Gross yield | Median asking rent | Rentals (12 mo) | Median closed price | Closings | Sales window | Confirmed-close median |
|---|---|---|---|---|---|---|---|---|
| 1 | Brooklyn Park | 8.3% | $2,450 | 175 | $355,000 | 483 | 6 months | n/a |
| 2 | Crystal | 8.1% | $2,200 | 59 | $325,000 | 170 | 6 months | n/a |
| 3 | Bemidji | 7.9% | $1,495 | 128 | $226,600 | 195 | 12 months | n/a |
| 4 | Blaine | 7.6% | $2,395 | 211 | $379,000 | 464 | 6 months | n/a |
| 5 | Apple Valley | 7.5% | $2,350 | 198 | $378,000 | 361 | 6 months | n/a |
| 6 | Andover | 7.5% | $2,795 | 68 | $450,000 | 251 | 6 months | n/a |
| 7 | Richfield | 7.3% | $2,170 | 174 | $357,000 | 240 | 6 months | n/a |
| 8 | Coon Rapids | 7.2% | $2,000 | 149 | $332,000 | 407 | 6 months | n/a |
| 9 | Ramsey | 7.2% | $2,300 | 71 | $385,000 | 251 | 6 months | n/a |
| 10 | Maple Grove | 7.1% | $2,593 | 273 | $438,950 | 706 | 6 months | n/a |
| 11 | Savage | 7.1% | $2,500 | 109 | $425,000 | 203 | 6 months | n/a |
| 12 | Rogers | 7.1% | $2,645 | 90 | $449,900 | 221 | 6 months | n/a |
| 13 | Oakdale | 6.9% | $2,095 | 101 | $365,000 | 205 | 6 months | n/a |
| 14 | Farmington | 6.9% | $2,200 | 110 | $385,000 | 262 | 6 months | n/a |
| 15 | Inver Grove Heights | 6.8% | $2,280 | 111 | $400,000 | 239 | 6 months | n/a |
| 16 | Shoreview | 6.8% | $2,312 | 82 | $406,950 | 232 | 6 months | n/a |
| 17 | Saint Michael | 6.8% | $2,549 | 91 | $449,030 | 269 | 6 months | n/a |
| 18 | Cottage Grove | 6.8% | $2,325 | 132 | $410,000 | 399 | 6 months | n/a |
| 19 | Hugo | 6.8% | $2,325 | 98 | $410,000 | 179 | 6 months | n/a |
| 20 | Saint Louis Park | 6.7% | $2,227 | 406 | $400,000 | 391 | 6 months | n/a |
City by city
1. Brooklyn Park, 8.3 percent gross
The numbers: $355,000 median closed price across 483 closings, $2,450 median asking rent across 175 listings, 8.3 percent gross. Full detail is on the Brooklyn Park market page.
2. Crystal, 8.1 percent gross
Crystal clears the rental bar narrowly, with 59 listings behind its $2,200 median, so its 8.1 percent yield deserves a wider margin of error than the bigger samples here. The numbers: $325,000 median closed price across 170 closings, $2,200 median asking rent across 59 listings, 8.1 percent gross. The Crystal market page carries the monthly figures.
3. Bemidji, 7.9 percent gross
At $226,600 to buy and $1,495 a month to rent, Bemidji yields 7.9 percent gross on 195 tracked closings. See the Bemidji page for the property mix and the price band.
4. Blaine, 7.6 percent gross
Blaine ranks fourth on yield but only eighth on entry price: the $2,395 median asking rent is doing the work, not a cheap purchase. The numbers: $379,000 median closed price across 464 closings, $2,395 median asking rent across 211 listings, 7.6 percent gross. Across all property types, homes there closed at a median of about $192 per square foot. Full detail is on the Blaine market page.
5. Apple Valley, 7.5 percent gross
The numbers: $378,000 median closed price across 361 closings, $2,350 median asking rent across 198 listings, 7.5 percent gross. Across all property types, homes there closed at a median of about $183 per square foot. Full detail is on the Apple Valley market page.
6. Andover, 7.5 percent gross
Rent is what puts Andover sixth here; on price alone it would sit twentieth of 20. The numbers: $450,000 median closed price across 251 closings, $2,795 median asking rent across 68 listings, 7.5 percent gross. See the Andover page for the property mix and the price band.
7. Richfield, 7.3 percent gross
Homes in Richfield closed at a median of $357,000 over the last six months and the median asking rent in the last twelve months was $2,170, a gross yield of 7.3 percent. Across all property types, homes there closed at a median of about $208 per square foot. The Richfield market page carries the monthly figures.
8. Coon Rapids, 7.2 percent gross
A low entry price does not carry Coon Rapids far: it is third cheapest on this list and eighth on yield, with rent of $2,000 against a $332,000 median price. Homes in Coon Rapids closed at a median of $332,000 over the last six months and the median asking rent in the last twelve months was $2,000, a gross yield of 7.2 percent. Full detail is on the Coon Rapids market page.
9. Ramsey, 7.2 percent gross
Only 71 rental listings sit behind Ramsey's $2,300 median; the yield is real but less settled than in cities with hundreds. The numbers: $385,000 median closed price across 251 closings, $2,300 median asking rent across 71 listings, 7.2 percent gross. The Ramsey market page carries the monthly figures.
10. Maple Grove, 7.1 percent gross
Maple Grove ranks tenth on yield but only seventeenth on entry price: the $2,593 median asking rent is doing the work, not a cheap purchase. The numbers: $438,950 median closed price across 706 closings, $2,593 median asking rent across 273 listings, 7.1 percent gross. Across all property types, homes there closed at a median of about $195 per square foot. Full detail is on the Maple Grove market page.
11. Savage, 7.1 percent gross
Rent is what puts Savage eleventh here; on price alone it would sit sixteenth of 20. Homes in Savage closed at a median of $425,000 over the last six months and the median asking rent in the last twelve months was $2,500, a gross yield of 7.1 percent. Across all property types, homes there closed at a median of about $182 per square foot. See the Savage page for the property mix and the price band.
12. Rogers, 7.1 percent gross
Rogers ranks twelfth on yield but only nineteenth on entry price: the $2,645 median asking rent is doing the work, not a cheap purchase. At $449,900 to buy and $2,645 a month to rent, Rogers yields 7.1 percent gross on 221 tracked closings. Full detail is on the Rogers market page.
13. Oakdale, 6.9 percent gross
A low entry price does not carry Oakdale far: it is sixth cheapest on this list and thirteenth on yield, with rent of $2,095 against a $365,000 median price. At $365,000 to buy and $2,095 a month to rent, Oakdale yields 6.9 percent gross on 205 tracked closings. Across all property types, homes there closed at a median of about $193 per square foot. The Oakdale market page carries the monthly figures.
14. Farmington, 6.9 percent gross
Farmington is cheaper than its yield rank suggests: ninth on price, fourteenth on yield, because a $385,000 home there rents for only $2,200. At $385,000 to buy and $2,200 a month to rent, Farmington yields 6.9 percent gross on 262 tracked closings. See the Farmington page for the property mix and the price band.
15. Inver Grove Heights, 6.8 percent gross
A low entry price does not carry Inver Grove Heights far: it is eleventh cheapest on this list and fifteenth on yield, with rent of $2,280 against a $400,000 median price. Homes in Inver Grove Heights closed at a median of $400,000 over the last six months and the median asking rent in the last twelve months was $2,280, a gross yield of 6.8 percent. The Inver Grove Heights market page carries the monthly figures.
16. Shoreview, 6.8 percent gross
Only 82 rental listings sit behind Shoreview's $2,312 median; the yield is real but less settled than in cities with hundreds. The numbers: $406,950 median closed price across 232 closings, $2,312 median asking rent across 82 listings, 6.8 percent gross. Across all property types, homes there closed at a median of about $210 per square foot. The Shoreview market page carries the monthly figures.
17. Saint Michael, 6.8 percent gross
Only 91 rental listings sit behind Saint Michael's $2,549 median; the yield is real but less settled than in cities with hundreds. At $449,030 to buy and $2,549 a month to rent, Saint Michael yields 6.8 percent gross on 269 tracked closings. Across all property types, homes there closed at a median of about $179 per square foot. See the Saint Michael page for the property mix and the price band.
18. Cottage Grove, 6.8 percent gross
Cottage Grove is cheaper than its yield rank suggests: fourteenth on price, eighteenth on yield, because a $410,000 home there rents for only $2,325. The numbers: $410,000 median closed price across 399 closings, $2,325 median asking rent across 132 listings, 6.8 percent gross. Across all property types, homes there closed at a median of about $194 per square foot. Full detail is on the Cottage Grove market page.
19. Hugo, 6.8 percent gross
A low entry price does not carry Hugo far: it is fourteenth cheapest on this list and nineteenth on yield, with rent of $2,325 against a $410,000 median price. At $410,000 to buy and $2,325 a month to rent, Hugo yields 6.8 percent gross on 179 tracked closings. Full detail is on the Hugo market page.
20. Saint Louis Park, 6.7 percent gross
Saint Louis Park is cheaper than its yield rank suggests: eleventh on price, twentieth on yield, because a $400,000 home there rents for only $2,227. At $400,000 to buy and $2,227 a month to rent, Saint Louis Park yields 6.7 percent gross on 391 tracked closings. Across all property types, homes there closed at a median of about $234 per square foot. Full detail is on the Saint Louis Park market page.
Priced, but too few rentals to rank
These cities cleared 100 tracked closings but fewer than 50 rental listings carried their name in the last twelve months, so no yield is printed for them.
| City | Median closed price | Closings | Rentals (12 mo) |
|---|---|---|---|
| Lino Lakes | $470,000 | 160 | 34 |
How this ranking is built
- •Cities: every Minnesota city where Resideline tracked at least 100 closings inside the municipal boundary in its reporting window (six or twelve months) and at least 50 rental listings under the city's name since November 4, 2025: 54 cities qualify and the table shows the 20 highest-yielding.
- •Prices: the median price homes closed at inside the city limits, from Resideline's tracked closings; the state comparison uses the statewide median of $369,000 across 42,537 closings.
- •Rents: the median advertised rent on rental listings Resideline tracked in the last twelve months, all property types, measured on the listings that carry the city's name (a postal footprint, wider than the city line in some places).
- •Confirmed-close medians: Observed rent blends two kinds of record: confirmed lease closes extracted from property records, and the final asking rent on listings that left Resideline tracking without a recorded close. Where a city has at least 30 confirmed closes in the window, their median is printed beside the asking figure; in the last twelve months about a quarter of Resideline's close episodes are confirmed closes. The asking and confirmed-close samples are separate, not paired, so a difference between their medians is not a measured gap on the same listings.
- •What is missing: taxes, insurance, vacancy, management and repairs, which turn a gross yield into a net one, and the unit mix, which differs between what sells and what rents.
Sources and related pages
- •Resideline tracked closings inside city limits (window per city, updated November 4, 2026) and rental listings since November 4, 2025; confirmed lease closes extracted from property records.
- •More Minnesota rankings: Cheapest cities to buy a house in Minnesota ranks the same kind of list with each city's price per square foot for houses, realized appreciation and days to contract beside the median, and Cap Rate by City ranks the Minnesota cities Resideline tracks by gross rental yield. The Minnesota housing market hub carries the statewide figures and the largest Minnesota markets by closings.
- •Asking rent vs observed rent compares live asking rents with final asking rents under that study's own definition; it says nothing about confirmed lease closes.
Prepared with Resideline's research pipeline and reviewed by Jeffrey Batista, Resideline's founder.
Frequently Asked Questions
Which Minnesota city has the highest asking rental yield?
Brooklyn Park, at 8.3 percent: a median asking rent of $2,450 against a median closed price of $355,000, on 483 closings and 175 rental listings. Rents and sales are separate samples, so the ratio is a screen rather than a guaranteed return on a given home.
Does the cheapest Minnesota city also have the highest asking rental yield?
No. Bemidji is the cheapest at $226,600 but ranks third on the ratio; Brooklyn Park leads because its asking rent is high relative to its price. The ratio is a screen, not a matched property yield.
Are these asking rents or confirmed lease closes?
The yield column uses the median asking rent on tracked listings. Where a city has at least 30 confirmed lease closes in the window, the table also shows their median, so you can see how far asking sits from closes there. Resideline's close records blend confirmed closes with final asking rents on listings that left tracking, and about a quarter of the last twelve months are confirmed closes.
How many Minnesota cities qualify?
Fifty-four, each with at least 100 tracked closings inside the city limits and 50 rental listings in the last twelve months; the table shows the 20 highest-yielding, plus one more that clears the closings bar but not the rental one.

About the author
Jeffrey Batista
Jeffrey Batista is the founder of Resideline, a real estate technology company building institutional grade valuation and investment analysis tools for real estate investors.
A software engineer with more than 10 years of experience, Jeffrey has worked across full stack development, infrastructure, data engineering, machine learning, and large scale systems. He left his engineering career to build Resideline full time.
Jeffrey is also a real estate investor with nearly a decade of hands on experience buying, renovating, managing, and analyzing residential properties. His experience on both sides of the industry, as an engineer and an investor, led him to build Resideline after seeing how fragmented and outdated many of the tools available to individual investors were.
Today, he leads the development of Resideline's proprietary data infrastructure, automated valuation models, rental analytics, and investment underwriting technology.
Run the numbers
- Rental property calculator: cash flow, cap rate, cash-on-cash and DSCR
- Rent estimate calculator: median rent by metro and bedroom count
- Real estate deal analyzer: ARV, rent, comps and a max offer for one address
Could your next Minnesota rental work?
See value and rent for a real address. The full report comes with a 7-day Pro trial: card required, cancel anytime in the first 7 days.
See this for a real address