Asking Rent vs Final Asking Rent: What 12 Months of Removed Listings Show
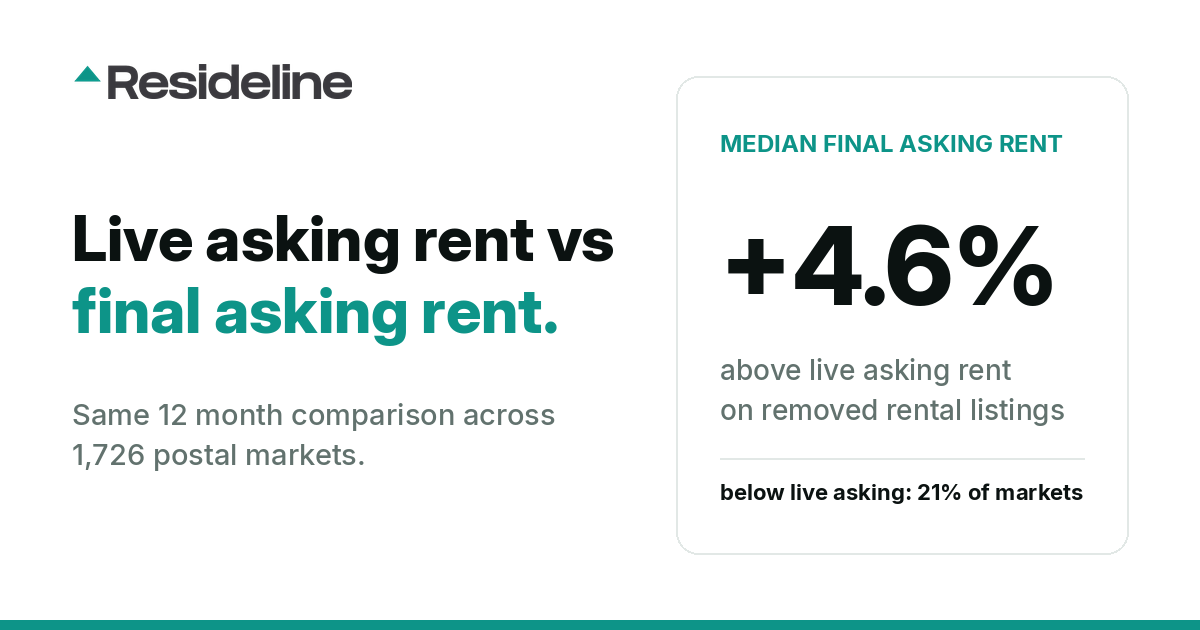
We compared live asking rents against the final asking rent on listings that left the market, in the same 12-month window, across 1,726 US postal areas. In the median postal area the final ask runs 4.6 percent above live asking, and only 21 percent of postal areas show the final ask below live asking. An earlier edition reported the opposite; this one explains why.
Every rent report you read is built on asking rents, the sticker a landlord posts the day a listing goes live. We wanted to know how far the sticker sits from where listings actually end up, so we compared the asking rent on live listings against the final asking rent on listings that left the market, in the same 12-month window, across 1,726 US postal markets with at least 50 listings on each side.
The headline is not the one most people expect. In the median postal area, the final asking rent on removed listings runs 4.6 percent above the current asking rent, not below it. Only 21 percent of qualifying postal areas show the final ask sitting below live asking. The markdown off asking that landlords assume they will give, and renters assume they will get, does not show up in listing data.
An earlier version of this study reported the opposite: listings leaving the market 8.7 percent below asking, in 84 percent of postal areas. That figure came from pooling every removed listing we had ever tracked, some of them years old, against a single recent year of asking rents. Old rents against new asks manufactures a gap below asking that is really just time. This edition compares the same 12 months on both sides, and the gap reverses. We are publishing the correction rather than quietly editing the number.
What "final asking rent" means, precisely
One definition before the tables, because it is the whole study. The rent side here is the final asking rent on a listing when it left the market. For about 7 percent of records the platform reported an explicit close, so a close was observed directly. For the remaining 93 percent the listing was removed and we take the last rent it asked. Neither is the agreement a tenant ends up on. Concessions, a free month, waived fees, and any negotiated difference from the posted rent are invisible in both cases, so this is the final asking rent, not a lease figure, and it is labelled Final Asking Rent throughout. Throughout, gap means median asking minus median final asking, as a share of asking: a positive gap means listings left the market asking less than the live stock asks now.
The 15 biggest rental markets we track
Here is the gap in the largest markets by removed-listing volume over the window.
| Postal area | Removed listings (n) | Median asking | Median final asking | Gap | Gap % |
|---|---|---|---|---|---|
| Miami, FL | 14,983 | $3,000 | $3,050 | -$50 | -1.7% |
| Los Angeles, CA | 7,516 | $3,100 | $3,700 | -$600 | -19.4% |
| Orlando, FL | 4,935 | $2,059 | $2,155 | -$96 | -4.7% |
| Houston, TX | 4,753 | $1,699 | $1,950 | -$251 | -14.8% |
| Philadelphia, PA | 4,422 | $1,700 | $1,800 | -$100 | -5.9% |
| Chicago, IL | 4,237 | $2,295 | $2,300 | -$5 | -0.2% |
| Fort Lauderdale, FL | 4,155 | $2,595 | $2,700 | -$105 | -4.0% |
| Las Vegas, NV | 4,034 | $2,012 | $2,132 | -$120 | -6.0% |
| Washington, DC | 3,848 | $2,795 | $3,000 | -$205 | -7.3% |
| Tampa, FL | 3,644 | $2,250 | $2,300 | -$50 | -2.2% |
| San Diego, CA | 3,563 | $3,249 | $3,650 | -$401 | -12.3% |
| San Antonio, TX | 3,480 | $1,650 | $1,700 | -$50 | -3.0% |
| Baltimore, MD | 3,239 | $1,750 | $1,995 | -$245 | -14.0% |
| Boston, MA | 3,029 | $3,600 | $3,500 | $100 | +2.8% |
| Cleveland, OH | 2,966 | $1,349 | $1,465 | -$116 | -8.6% |
Where listings do leave asking less
A positive gap, the final ask below live asking, is the minority case, and it clusters in Florida. These are the widest, among postal areas with at least 200 removed listings.
| Postal area | Removed listings (n) | Median asking | Median final asking | Gap | Gap % |
|---|---|---|---|---|---|
| Saint Augustine, FL | 561 | $2,475 | $2,200 | $275 | +11.1% |
| Davenport, FL | 1,243 | $2,400 | $2,150 | $250 | +10.4% |
| Mobile, AL | 467 | $1,595 | $1,450 | $145 | +9.1% |
| Brandon, FL | 278 | $2,195 | $2,000 | $195 | +8.9% |
| Kissimmee, FL | 2,563 | $2,295 | $2,100 | $195 | +8.5% |
| Coconut Creek, FL | 276 | $2,400 | $2,200 | $200 | +8.3% |
| Dana Point, CA | 342 | $5,450 | $5,000 | $450 | +8.3% |
| Cutler Bay, FL | 306 | $2,700 | $2,500 | $200 | +7.4% |
| Bentonville, AR | 223 | $1,995 | $1,850 | $145 | +7.3% |
| Key Biscayne, FL | 255 | $7,000 | $6,500 | $500 | +7.1% |
| Satellite Beach, FL | 201 | $2,900 | $2,700 | $200 | +6.9% |
| New Port Richey, FL | 448 | $1,850 | $1,725 | $125 | +6.8% |
Where the final ask runs furthest above asking
| Postal area | Removed listings (n) | Median asking | Median final asking | Gap | Gap % |
|---|---|---|---|---|---|
| Bloomington, IN | 309 | $1,850 | $2,750 | -$900 | -48.6% |
| Sherman Oaks, CA | 412 | $3,300 | $4,750 | -$1,450 | -43.9% |
| Sioux Falls, SD | 255 | $1,210 | $1,725 | -$515 | -42.6% |
| Salem, OR | 233 | $1,550 | $2,200 | -$650 | -41.9% |
| Lincoln, NE | 442 | $1,215 | $1,700 | -$485 | -39.9% |
| Omaha, NE | 749 | $1,460 | $1,950 | -$490 | -33.6% |
| Portland, OR | 1,127 | $1,895 | $2,500 | -$605 | -31.9% |
| Bozeman, MT | 220 | $2,324 | $3,000 | -$676 | -29.1% |
| Tacoma, WA | 420 | $1,950 | $2,495 | -$545 | -27.9% |
| Fort Wayne, IN | 249 | $1,249 | $1,595 | -$346 | -27.7% |
What this means if you are a landlord
Do not underwrite to a haircut off asking that you cannot see in the data. In the median market the listings that left the market were asking about 5 percent more than today's live stock, not less, so a pro forma that assumes a haircut off asking is assuming something the market is not showing. Anchor to the final asking rent on comparable listings that actually left the market, labelled as such, and treat the live ask as an opening position rather than a ceiling. We walk through the underwriting side in our guide to calculating rental property cash flow.
What this means if you are a renter
In 79 percent of qualifying postal areas the final ask on removed listings sat at or above live asking, so the sticker is not systematically padded. Where there is room, it is small and local: the Florida markets in the table above ran 7 to 11 percent. Knowing which market you are in matters more than any national rule of thumb. Our free market tools are the place to check the data for your area before you negotiate.
Methodology
- •Rent side. The final asking rent on listings that left the market in the 12 months from 2025-08-22, deduplicated by address and removal date. About 7 percent carry an explicit close event; the rest use the last rent asked. This is the final asking rent, not a lease figure.
- •Asking side. The live asking rent on listings in the same 12-month window, from our full rentals corpus.
- •Geography. Every market here is a postal area, the city name that routes a property's mail, not a municipal boundary. Our per-city market pages measure Census municipal boundaries instead, so the same name can carry different figures across this site.
- •Inclusion. At least 50 listings on each side in the window; 1,726 postal areas qualify. Tables of extremes require at least 200.
- •Medians. Every figure is a median, and every gap is median asking minus median final asking as a share of asking. Medians of two different pools diverge for composition reasons as well as pricing reasons, which is the right way to read the negative-gap table.
- •What changed from the first edition. The first edition pooled lifetime removed listings against a 12-month asking window and reported final asks 8.7 percent below asking in 84.1 percent of 993 postal areas. Aligning both sides to the same window reverses the sign. The scan behind this edition was generated 2026-08-22.
- •Limitations. Concessions negotiated off the listing are not visible to us, so true effective rents can differ from both figures here in either direction.
If you want this data applied to a specific address instead of a postal area median, Resideline analyzes any address with the data behind this study. More from the same data desk: what home sellers actually made, city by city, and how to track a rental portfolio like a stock portfolio.
Frequently Asked Questions
What is the difference between asking rent and final asking rent?
Asking rent is the live price on an active listing. Final asking rent is the last rent a listing asked before it left the market, which for about 93 percent of records is the final posted price rather than an observed close. Across 1,726 qualifying US postal areas on a like-for-like 12-month window, the median final asking rent runs 4.6 percent above the median live asking rent.
Do rentals actually go for less than the listed price?
Not systematically, in listing data. Only 21 percent of qualifying postal areas show the final ask below live asking, and where it is, the gap is small: the widest among markets with 200 or more removed listings is Saint Augustine, FL at 11.1 percent. What listing data cannot see is the contract a tenant signs, or any concession, so the true effective rent can differ in either direction.
Is rent negotiable?
The data offers little support for a standard markdown off asking. In the median postal area, listings that left the market were asking about 5 percent more than the live stock, not less. Room to negotiate is local and small where it exists, concentrated in Florida markets at roughly 7 to 11 percent.
Why did this study previously report final asks 8.7 percent below asking?
The first edition pooled every removed listing we had ever tracked, some years old, against a single recent year of asking rents, so old rents were compared with new asks and the age difference read as a gap below asking. Aligning both sides to the same 12 months reverses the sign. We published the correction rather than quietly changing the number.
Why do some cities show the final ask far above asking?
Composition. Median asking covers everything currently listed while median final asking covers what left the market, and in a college town like Bloomington, IN or a fast-turning market like Portland the units that leave skew larger or better located. It is a caution about mix, not evidence that tenants bid above sticker.

About the author
Jeffrey Batista
Jeffrey Batista is the founder of Resideline, a real estate technology company building institutional grade valuation and investment analysis tools for real estate investors.
A software engineer with more than 10 years of experience, Jeffrey has worked across full stack development, infrastructure, data engineering, machine learning, and large scale systems. He left his engineering career to build Resideline full time.
Jeffrey is also a real estate investor with nearly a decade of hands on experience buying, renovating, managing, and analyzing residential properties. His experience on both sides of the industry, as an engineer and an investor, led him to build Resideline after seeing how fragmented and outdated many of the tools available to individual investors were.
Today, he leads the development of Resideline's proprietary data infrastructure, automated valuation models, rental analytics, and investment underwriting technology.
Could the rent make this property work?
Create a free account to review rental comps, model operating costs and explore projected cash flow.
Create a free account3 free reports at signup. No card required.