What Sellers Actually Made: Real Home Appreciation by City, From 6.96 Million Repeat Sales
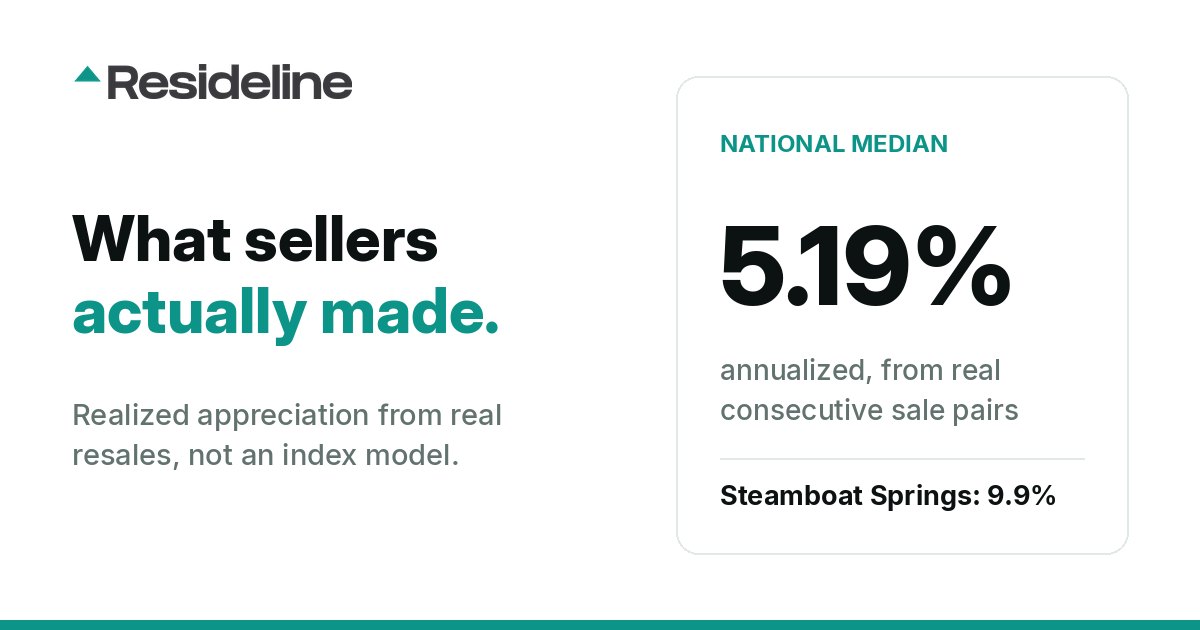
Index-based appreciation is modeled. We measured what sellers actually made, using 6,963,756 pairs of consecutive sales of the same home. The national median is 5.19 percent a year, and the gap between the best and worst metros is 8.42 points, every year.
Most published home appreciation figures are modeled. A price index takes thousands of sales, adjusts them statistically, and estimates what a typical home in a market would have done if it had sold. That is useful, but nobody owns a typical home.
We did something more direct. We pulled 6,963,756 pairs of consecutive sales of the same home from our national property corpus, what an owner paid and what that same home later sold for, and computed the annualized price change for each pair. Holds ranged from 1 to 30 years. Then we took the median for every metro with enough pairs to be meaningful.
The result is realized appreciation, the return sellers actually booked, not what a model says the market did.
The headline: the national median is 5.19 percent a year. Half of the repeat sales in our data annualized above that, half below. Around that median, the spread between metros is enormous. The top qualifying metro, Steamboat Springs, CO, posted a median of 9.91 percent a year. The bottom, New York, NY, posted 1.49 percent. That is a gap of 8.42 percentage points a year between the best and worst qualifying markets, compounding, for the median seller.
Realized appreciation is not index appreciation
Before the rankings, it is worth being precise about what this number is, because it is not the same thing as an index, and the differences are the whole point.
- •It includes what owners did to the home. If a house got a new kitchen and a roof between its two sales, the full gain is in our number. An index tries to strip that out. We deliberately keep it in, because it is part of what the seller actually collected. In that sense it sits closer to an after repair value than to a pure market return.
- •It only counts homes that traded twice. Homes that never resold are invisible here. If renovated homes trade more often, or distressed homes trade in waves, the median reflects that selection. Indexes model around it, we report it.
- •It is a median, not an average. One spectacular resale does not drag the metro figure. Half of sellers in each market did better than the number shown, half did worse.
Indexes and automated models also share a structural weakness, they cannot see condition in transaction records alone, something we covered in the condition blind spot in automated valuations. Repeat-sale pairs sidestep the modeling entirely. Both sales happened, both prices are recorded, and we are just doing division.
Where sellers made the most
| Rank | Metro (postal area) | Median annual appreciation | Sale pairs |
|---|---|---|---|
| 1 | Steamboat Springs, CO | 9.91% | 932 |
| 2 | Lake Worth Beach, FL | 9.07% | 1,358 |
| 3 | Rosemary Beach, FL | 8.92% | 1,039 |
| 4 | Key Largo, FL | 8.68% | 1,277 |
| 5 | Scranton, PA | 8.60% | 1,328 |
| 6 | Newark, NJ | 8.37% | 1,827 |
| 7 | Providence, RI | 8.12% | 5,594 |
| 8 | Holly Ridge, NC | 8.10% | 1,016 |
| 9 | Muskegon, MI | 8.09% | 2,832 |
| 10 | Southport, NC | 8.05% | 2,497 |
| 11 | Bentonville, AR | 8.03% | 1,931 |
| 12 | Loxahatchee, FL | 8.02% | 1,348 |
| 13 | Portland, ME | 8.02% | 1,178 |
| 14 | East Stroudsburg, PA | 7.99% | 1,020 |
| 15 | Miami Gardens, FL | 7.98% | 1,015 |
The second story is less obvious, affordable Northeast metros. Scranton, PA at 8.60 percent, Newark, NJ at 8.37, and Providence, RI at 8.12 all beat nearly every famous coastal market. Providence is the most convincing entry in the table, its 8.12 percent median rests on 5,594 pairs, the largest sample in the top 15. Muskegon, MI at 8.09 and Bentonville, AR at 8.03 round out the pattern, sellers in modestly priced markets have been quietly outperforming.
Where sellers made the least
| Rank | Metro (postal area) | Median annual appreciation | Sale pairs |
|---|---|---|---|
| 1 | New York, NY | 1.49% | 7,501 |
| 2 | Center Point, AL | 2.35% | 2,431 |
| 3 | Cordova, TN | 2.67% | 3,204 |
| 4 | Huntley, IL | 2.91% | 1,194 |
| 5 | Lawton, OK | 2.94% | 2,684 |
| 6 | Peoria, IL | 2.95% | 4,695 |
| 7 | Bessemer, AL | 3.01% | 1,215 |
| 8 | Montgomery, AL | 3.08% | 2,690 |
| 9 | Paradise, CA | 3.12% | 1,330 |
| 10 | Johnston, IA | 3.13% | 865 |
| 11 | Enid, OK | 3.15% | 1,302 |
| 12 | Maumelle, AR | 3.21% | 1,215 |
| 13 | Cedar Rapids, IA | 3.23% | 5,137 |
| 14 | Broadview Heights, OH | 3.23% | 917 |
| 15 | Westlake, OH | 3.25% | 902 |
The rest of the low table is mostly the Midwest and inland South. Alabama appears three times, Center Point at 2.35, Bessemer at 3.01, and Montgomery at 3.08. Oklahoma appears twice, Lawton at 2.94 and Enid at 3.15. Iowa, Illinois, and suburban Ohio fill most of the remaining rows. Paradise, CA at 3.12 percent is the only Western metro on the list.
The biggest markets, ranked by evidence
For the largest metros, the sample sizes get big enough that the medians are very hard to argue with.
| Metro (postal area) | Sale pairs | Median annual appreciation |
|---|---|---|
| Las Vegas, NV | 65,037 | 5.29% |
| Phoenix, AZ | 38,676 | 6.18% |
| Minneapolis, MN | 36,405 | 4.25% |
| Chicago, IL | 34,207 | 3.32% |
| Miami, FL | 31,847 | 6.62% |
| Jacksonville, FL | 31,807 | 4.99% |
| Atlanta, GA | 31,052 | 5.10% |
| Tucson, AZ | 29,669 | 5.30% |
| Philadelphia, PA | 27,760 | 4.94% |
| Colorado Springs, CO | 26,556 | 4.63% |
| Cincinnati, OH | 25,329 | 4.71% |
| Portland, OR | 24,959 | 4.50% |
| Denver, CO | 24,502 | 5.21% |
| Orlando, FL | 24,200 | 5.77% |
| Tampa, FL | 23,796 | 6.37% |
For anyone underwriting a purchase or a renovation, this is the honest input, gross realized gains, with improvement dollars still inside them. It is exactly why disciplined buyers work backward from resale value and costs rather than counting on the market, the logic behind the 70 percent rule.
Methodology
We scanned 6,040,171 property records in our national lookup corpus and extracted 6,963,756 valid pairs of consecutive sales of the same home. For each pair we annualized the gross price change between the two sales, with hold periods of 1 to 30 years, and computed the median annualized figure per metro. Data was generated on August 14, 2026.
Sale pairs appeared across 3,124 postal areas, of which 1,472 had enough pairs to qualify for ranking. A market here is a postal area, the city name that routes a property's mail, not a municipal boundary: New York, NY is the Manhattan postal city rather than the five boroughs. Our per-city market pages measure Census municipal boundaries instead, so the same name can carry different figures across this site. Every metro shown in the tables above has at least 865 recorded pairs, and the large-market table runs as high as 65,037 pairs in Las Vegas.
Three limitations, stated plainly. All figures are medians, and individual results vary widely around them. Metro coverage varies with our data density, so a market missing from these tables reflects a data gap, not a judgment about that market. And these are gross price changes between sales, they do not net out renovation spend, transaction costs, or carrying costs, so a seller's true profit is lower than the appreciation figure alone.
History, not a forecast
None of this predicts what any market does next. Steamboat Springs earning 9.91 percent for past sellers says nothing about the next buyer's outcome, and New York's 1.49 percent is a record of what happened, not a ceiling on what can. What the data does establish is that realized outcomes vary far more by metro than national averages suggest, and that the market you buy in has historically mattered as much as the home you buy. More from the same corpus: two-market cities, where one median hides two housing markets, and asking rent vs Observed rent across 2.9 million rental listings that left the market.
Resideline runs this same repeat-sales corpus under every address it analyzes, and you can put any property through it with our free tools.
Frequently Asked Questions
How much do homes actually appreciate per year?
Across 6,963,756 pairs of consecutive sales of the same home, the national median realized appreciation was 5.19 percent a year. That figure is a median of actual seller outcomes, including any improvements owners made, not a modeled index.
Which city has the highest real home appreciation rate?
Steamboat Springs, CO led all 1,472 qualifying metros with a median realized appreciation of 9.91 percent a year across 932 sale pairs, followed by resort Florida markets like Lake Worth Beach at 9.07 percent and Rosemary Beach at 8.92 percent.
Why is realized appreciation different from index appreciation?
Realized appreciation measures the actual price change between two sales of the same home, so it includes the value of renovations owners made and reflects only the homes that actually traded twice. Indexes try to model those effects out; our figures deliberately keep them in because they are part of what sellers actually collected.
Which major market had the lowest realized appreciation?
New York, NY posted the lowest median of all qualifying metros at 1.49 percent a year across 7,501 sale pairs. Among the 15 largest samples, Chicago was lowest at 3.32 percent while Miami was highest at 6.62 percent.
Does this data predict future home appreciation?
No. These figures are a historical record of what sellers actually made between two real sales. They show how widely outcomes have varied by metro, but past medians are not a forecast of any market's future performance.

About the author
Jeffrey Batista
Jeffrey Batista is the founder of Resideline, a real estate technology company building institutional grade valuation and investment analysis tools for real estate investors.
A software engineer with more than 10 years of experience, Jeffrey has worked across full stack development, infrastructure, data engineering, machine learning, and large scale systems. He left his engineering career to build Resideline full time.
Jeffrey is also a real estate investor with nearly a decade of hands on experience buying, renovating, managing, and analyzing residential properties. His experience on both sides of the industry, as an engineer and an investor, led him to build Resideline after seeing how fragmented and outdated many of the tools available to individual investors were.
Today, he leads the development of Resideline's proprietary data infrastructure, automated valuation models, rental analytics, and investment underwriting technology.
What is your property worth today?
Create a free account to review current comps and model your property’s potential returns.
Create a free account3 free reports at signup. No card required.