America's Two-Market Cities: Where One Median Hides Two Housing Markets
Within a single city, the 75th percentile sale can trade at three or four times the 25th percentile on price per square foot. We ranked 1,039 US postal areas by this spread ratio and found two very different causes, luxury geography and condition bimodality.
Every American city reports one median home price. In a surprising number of cities, that single number papers over two housing markets that barely touch each other.
We went looking for those cities. Across 1,039 qualifying postal areas in our closed-sale corpus, we computed price per square foot for every sale, then compared the 75th percentile sale to the 25th percentile sale in each market. We call that ratio the spread ratio. The national median is 1.4x, meaning that in a typical city the 75th percentile sale costs about 40 percent more per square foot than the 25th. That is ordinary texture, nicer streets, newer kitchens, a little more land.
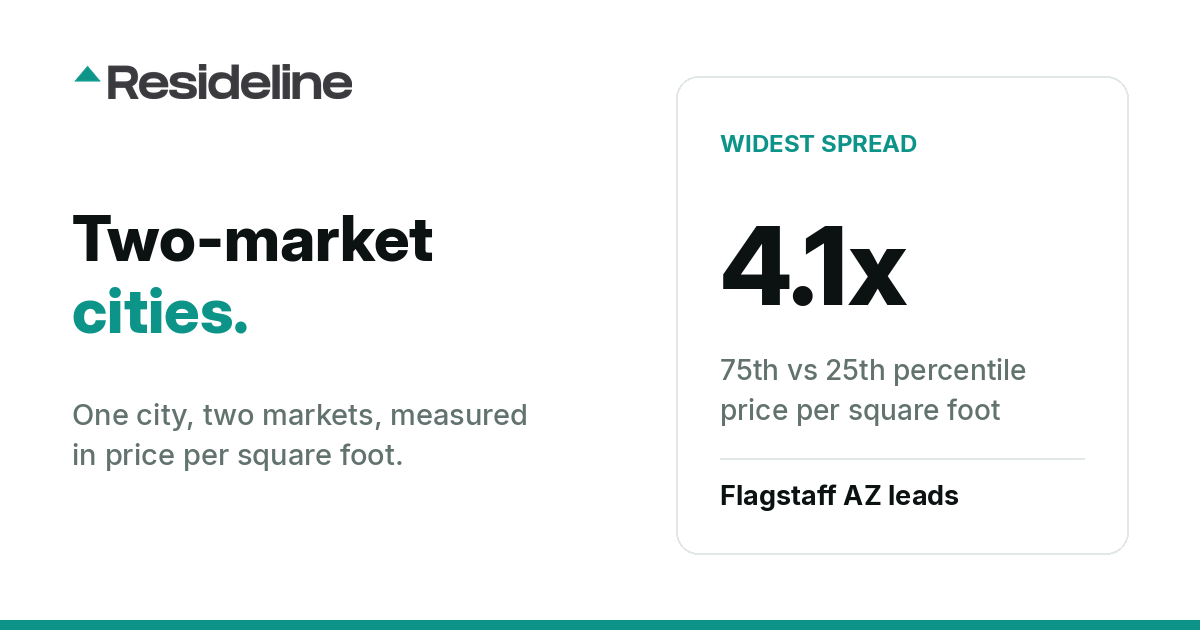
Then there is Flagstaff, Arizona, where the ratio is 4.12x. Birmingham, Alabama sits at 3.08x and Gary, Indiana at 3.07x. In cities like these, the citywide figure describes almost no actual house.
How we measured the spread
The geography. Our unit here is the postal area: the city name that routes a property's mail on the sale record, not a municipal boundary. The distinction matters most in exactly the markets this article is about. Birmingham's mail also covers Mountain Brook, Vestavia Hills, Homewood and Hoover, which are separate and far wealthier municipalities, so postal Birmingham is several cities wearing one name. Every figure below describes a postal area, and the methodology section reconciles them with the municipal figures on our per-city market pages.
For each postal area with enough closed sales to trust, we computed each sale's price per square foot, then took the 25th percentile, the median, and the 75th percentile. The spread ratio is simply the 75th percentile divided by the 25th. A ratio near 1.2x describes a market where most homes are roughly interchangeable. A ratio above 3x describes a city where the top quartile and the bottom quartile are, functionally, different markets.
The widest two-market cities
| Rank | Metro (postal area) | Spread ratio | 25th pct $/sqft | 75th pct $/sqft | Median $/sqft | Closed sales |
|---|---|---|---|---|---|---|
| 1 | Flagstaff, AZ | 4.12x | $374.70 | $1,543.40 | $651.20 | 1,258 |
| 2 | Birmingham, AL | 3.08x | $70.70 | $217.80 | $145.90 | 6,610 |
| 3 | Gary, IN | 3.07x | $34.80 | $107.00 | $70.90 | 989 |
| 4 | Flint, MI | 2.93x | $37.40 | $109.40 | $68.50 | 1,908 |
| 5 | Loveland, OH | 2.74x | $73.30 | $200.70 | $137.80 | 1,767 |
| 6 | Delray Beach, FL | 2.65x | $143.70 | $380.20 | $236.30 | 4,395 |
| 7 | Bessemer, AL | 2.57x | $60.20 | $155.00 | $118.20 | 1,033 |
| 8 | Santa Rosa Beach, FL | 2.48x | $307.40 | $763.20 | $503.80 | 1,532 |
| 9 | Cleveland, OH | 2.46x | $58.60 | $144.00 | $99.10 | 9,516 |
| 10 | Macon, GA | 2.43x | $56.80 | $137.90 | $105.50 | 2,307 |
| 11 | Philadelphia, PA | 2.40x | $111.10 | $266.60 | $186.70 | 19,493 |
| 12 | Montgomery, AL | 2.39x | $50.50 | $120.90 | $85.50 | 1,798 |
| 13 | Detroit, MI | 2.37x | $43.70 | $103.40 | $69.50 | 7,435 |
| 14 | Jackson, MS | 2.36x | $50.80 | $119.80 | $88.50 | 1,316 |
| 15 | Sunrise, FL | 2.35x | $133.50 | $313.70 | $249.90 | 1,109 |
- •The Deep South and the industrial Midwest dominate the list: Birmingham, Bessemer, Montgomery, Macon, Jackson, Gary, Flint, Detroit, Cleveland.
- •Florida appears three times, Delray Beach, Santa Rosa Beach, and Sunrise, and always in coastal markets.
- •Flagstaff is in a category of its own, with a gap of $1,168.70 per square foot between its 25th and 75th percentile sales.
Two causes, one symptom
The wide-spread cities split into two very different stories, and the difference matters for how you value property in them.
Luxury geography. Flagstaff's spread is driven from the top. Its 25th percentile, $374.70 per square foot, is not cheap. That floor is higher than the 75th percentile of all but one metro on our narrowest list. What stretches the ratio is the ceiling, a 75th percentile of $1,543.40 that is more than double the metro's own median of $651.20. Resort and luxury stock trades in one market while ordinary rural stock trades in another. The Florida coastal entries rhyme with this: Delray Beach runs from $143.70 to $380.20 and Santa Rosa Beach from $307.40 to $763.20, splits drawn largely by location and product type.
Condition bimodality. Birmingham, Gary, Flint, Detroit, and Cleveland are the opposite case. Here the bottom drops out. Gary's 25th percentile sale trades at $34.80 per square foot against a renovated tier at $107.00, a gap of $72.20 on every square foot. Birmingham's 25th percentile of $70.70 is less than half its postal-area median of $145.90. These markets carry a large stock of distressed and dated homes trading far below the renovated stock, sometimes on the same street. We measured that gap metro by metro in the renovation premium study, and the distress language index maps where the distressed half of the market surfaces in listings. The split is condition, not geography, and it is exactly the gap between as-is value and after-repair value that we walk through in what ARV means in real estate.
The narrowest markets
| Rank | Metro (postal area) | Spread ratio | 25th pct $/sqft | 75th pct $/sqft | Median $/sqft | Closed sales |
|---|---|---|---|---|---|---|
| 1 | Foley, AL | 1.19x | $162.60 | $193.50 | $179.00 | 1,282 |
| 2 | Denham Springs, LA | 1.19x | $141.00 | $167.10 | $153.60 | 1,284 |
| 3 | Olive Branch, MS | 1.20x | $145.40 | $174.80 | $160.90 | 826 |
| 4 | Apopka, FL | 1.21x | $190.70 | $230.10 | $209.90 | 1,838 |
| 5 | Lewisville, TX | 1.21x | $192.20 | $232.00 | $213.60 | 920 |
| 6 | Southaven, MS | 1.21x | $140.10 | $170.10 | $158.30 | 821 |
| 7 | Garner, NC | 1.21x | $167.70 | $202.40 | $183.30 | 1,263 |
| 8 | Princeton, TX | 1.21x | $144.20 | $174.70 | $158.30 | 1,694 |
| 9 | Rancho Santa Margarita, CA | 1.21x | $574.40 | $694.70 | $629.70 | 803 |
| 10 | Raeford, NC | 1.21x | $140.30 | $169.20 | $155.60 | 1,199 |
Why the citywide median fails investors
In a 1.2x market, the citywide number gets you most of the way to a fair price. In a 3x market it is nearly meaningless. Gary's median of $70.90 per square foot sits roughly halfway between two real markets, one trading around $34.80 and one around $107.00, and describes neither. Underwrite off the median and you will systematically overpay for distressed stock and pass on fairly priced renovated stock.
The practical rules we draw from this:
- •In a wide-spread city, comps must come from the same submarket and the same condition tier as the subject. A renovated comp is not evidence about a distressed subject, and vice versa.
- •If you underwrite flips with the 70 percent rule, the ARV input must come from renovated comps only. Blending tiers corrupts the whole formula.
- •Expect automated valuations to struggle most in exactly these cities. A model leaning on citywide or area price levels is averaging two different markets, which is the condition blind spot in automated valuations in its purest form.
Methodology
We scanned 4,907,807 closed sale records covering a 365-day window of sales after our cutoff of August 14, 2025, with the study generated on August 14, 2026. Our sold corpus keeps 2,235 postal areas, each with a minimum of 400 closed sales in the window, and 1,039 postal areas met the additional data-quality bar for this spread analysis.
All figures are medians and percentiles of closed-sale price per square foot, not averages and not list prices. Metro coverage varies with our data density, so some markets you might expect to see are absent simply because we do not yet hold enough closed sales there to publish a number we trust. Percentile spreads are also sensitive to product mix, so a metro that spans resort condos and rural acreage will read wider than a bedroom suburb even at similar quality levels, which is part of what the ratio is measuring and part of its limitation.
Postal areas, not municipalities. Every market in this study is a postal area, selected by the city name on the sale record. Our per-city market pages measure a different footprint: closed sales inside the Census municipal polygon, over a 6-month window for most cities. The same name therefore carries two numbers across this site, and each is right for what it measures. Birmingham reads $145.90 per square foot as a postal area here and $89 inside the city limits on the Birmingham market page; Flagstaff reads $651.20 here and $908 in-limits on the Flagstaff market page. We checked whether the spread itself is an artifact of mail geography, and it is not: fourteen of the fifteen widest postal areas above have a Resideline city page, and re-measured inside Census city limits on our city-page window, thirteen of those fourteen still spread wider than 2.3x. Birmingham is in fact wider in-limits, at 4.25x. The one exception is Loveland, Ohio, where only 13 percent of the sales we track under that postal name fall inside the city limits and the in-limits spread is 1.34x rather than 2.74x, which makes that row a fact about the mail area rather than about the city.
Resideline analyzes any address against this same closed-sale corpus, pulling comps from the subject's own submarket and condition tier, and you can start with any address in our free tools.
Frequently Asked Questions
What is a spread ratio?
The spread ratio is the 75th percentile price per square foot divided by the 25th percentile among closed sales within a single postal area, the city name that routes a property's mail rather than a municipal boundary. Across the 1,039 postal areas that qualified for our study, the national median spread ratio is 1.4x.
Which US city has the widest price per square foot spread?
Flagstaff, AZ, at 4.12x across 1,258 closed sales in the Flagstaff postal area in our window. Our Flagstaff city page measures Census city limits instead and reports a different median. Its 25th percentile sale traded at $374.70 per square foot while its 75th percentile traded at $1,543.40, driven by resort and luxury stock coexisting with ordinary rural stock.
Why are automated valuations often wrong in cities like Birmingham or Gary?
Because those cities contain two distinct markets, distressed stock and renovated stock, that trade roughly 3x apart per square foot. A valuation model that leans on citywide or area price levels ends up averaging both markets and describing neither, which is why comps must come from the subject's own submarket and condition tier.
What causes a wide spread ratio?
We see two distinct causes. Luxury geography, as in Flagstaff, where a high-end resort tier stretches the top of the market. And condition bimodality, as in Birmingham (3.08x) and Gary (3.07x), where a large distressed tier drags the bottom far below the renovated tier.

About the author
Jeffrey Batista
Jeffrey Batista is the founder of Resideline, a real estate technology company building institutional grade valuation and investment analysis tools for real estate investors.
A software engineer with more than 10 years of experience, Jeffrey has worked across full stack development, infrastructure, data engineering, machine learning, and large scale systems. He left his engineering career to build Resideline full time.
Jeffrey is also a real estate investor with nearly a decade of hands on experience buying, renovating, managing, and analyzing residential properties. His experience on both sides of the industry, as an engineer and an investor, led him to build Resideline after seeing how fragmented and outdated many of the tools available to individual investors were.
Today, he leads the development of Resideline's proprietary data infrastructure, automated valuation models, rental analytics, and investment underwriting technology.
Check the evidence behind your property’s value.
Create a free account to inspect comps and the assumptions behind your property’s estimated value.
Create a free account3 free reports at signup. No card required.