Kirkland, WA Housing Market 2026: What Homes Actually Sell For
What homes actually sell for in Kirkland: a median closing price of $1,249,725 across 724 closings Resideline tracked over the last six months, plus the full price spread and a ZIP-level breakdown.
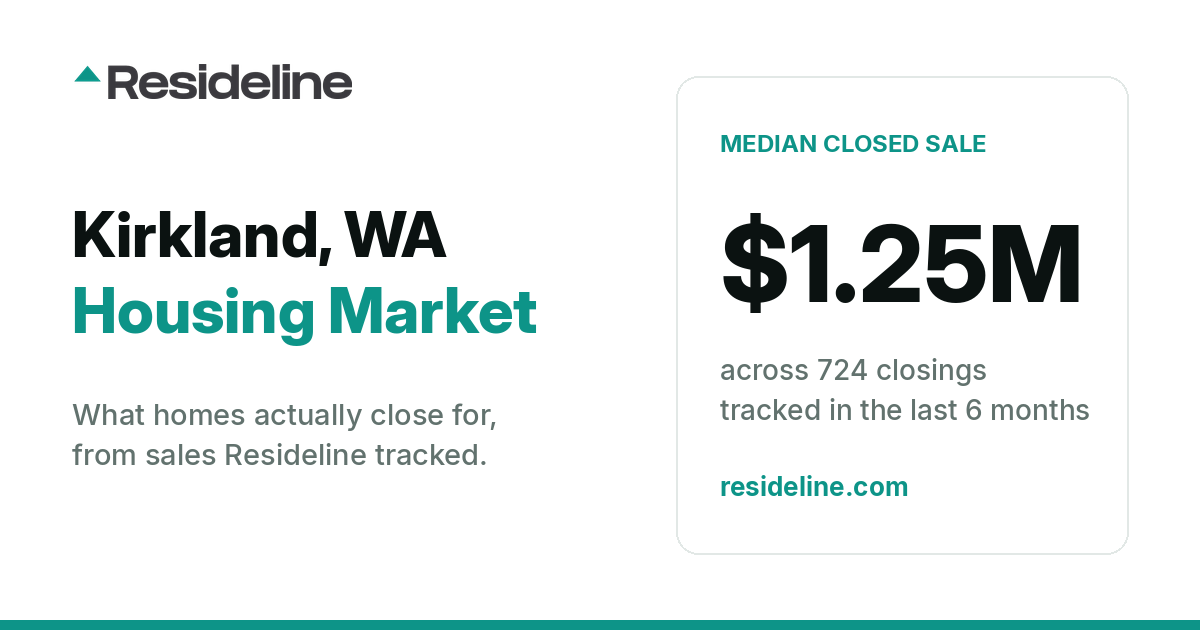
Kirkland produces a steady stream of closings but little consensus: sales over the last six months span a range wide enough that the median is a midpoint between different markets, not a going rate. The distribution below matters more than the headline.
The snapshot
- •Closings tracked, last 6 months: 724
- •Median sold price, last 6 months: $1,249,725
- •Median sold $/sqft, last 6 months: $645
- •Middle half of sales closed between: $920,000 and $1,875,000
What the numbers say
Resideline tracked 724 closed sales in Kirkland over the last six months, with a median closing price of $1,249,725. That median is the midpoint of what buyers actually paid, not what sellers hoped to get, which is why it moves differently from the asking prices you see on listing sites. The middle half of those sales closed between $920,000 and $1,875,000. That spread matters more than the headline median: where a specific property sits inside it decides whether the citywide number helps you or misleads you. These are the closings Resideline tracks and may differ from complete county or municipal records. Across the 723 closings with usable living area, the middle half sold between $526 and $773 per square foot.
Figures last updated November 4, 2026 from closings Resideline tracked.
Median home price in Kirkland, WA (October 2026)
The median home price in Kirkland is $1,249,725, measured across the 724 closed sales Resideline tracked over the last six months. The middle half of those sales closed between $920,000 and $1,875,000.
Where Kirkland sale prices land
Medians hide the shape of a market. The distribution above covers the closed sales Resideline tracked in Kirkland over the last six months that carry a usable sale date, trimmed to the 5th through 95th percentile, with the middle half of sales closing between $920,000 and $1,875,000. Among the 74 Washington markets with a published band, Kirkland's middle-half spread ($920,000 to $1,875,000) ranks 70th from the narrowest. Where your target property sits inside that spread matters more than the citywide median.
How long a sale takes here
- •Listed to under contract: a median of 16 days, across 470 Kirkland closings Resideline tracked in the last six months
- •Contract to closing: a median of 27 days, across 458 Kirkland closings Resideline tracked in the last six months
Both are measured from the closings themselves, not from listing inventory. Each sale is timed using its own listing and contract dates. That is why these counts are smaller than the 724 closings above: a sale is counted here only when we hold both of its dates.
The Kirkland angle
Kirkland offers plenty of closings and plenty of variation. The width means $1,249,725 is a weak anchor for any one property; the depth means you have a real alternative to using it. Build the alternative. Filter on property type, then a narrow size range, then condition, and confirm the count at each step rather than at the end. When the set is assembled, look at where it sits: the upper half of the band covers more dollars than the lower half, so comps above $1,249,725 carry more absolute spread and a high-leaning set will produce a higher answer than a balanced one. Correct that in the comp selection, not with a percentage applied afterwards.
Kirkland market data by ZIP code
Citywide medians hide block-by-block variation. Resideline publishes free, regularly refreshed market snapshots for Kirkland ZIP codes: 98033 · 98034.
From market read to offer price
A spread this wide means the citywide number cannot price a specific address; the step that matters is the property-level read. The decision still comes down to one property and one number: what it is actually worth and what you should pay. Every Resideline report opens with this same market snapshot for the subject's exact ZIP code, then gives you the property's value, the sold comps behind it, and a market rent estimate. Pricing a specific deal? The free ARV calculator, rehab cost estimator, BRRRR calculator and rental property calculator run the numbers in about a minute.
And we show our work. Every estimate is frozen while the home is for sale and graded against the real closing price after it sells. See the live accuracy dashboard for the receipts, or read how the Area Market Snapshot works.
Run any Kirkland address through Resideline and you will see the local market and the property's value together, in one report.
Cite this
Using these numbers? Please cite the source and the sample size:
Source: Resideline Market Watch
Market: Kirkland, WA
Geography: incorporated municipality, Census place 5335940
Data updated: October 2026
Analysis period: last six months
Tracked closings: 724
Median sold price: $1,249,725
Median sold $/sqft: $645 (723 qualifying)
https://resideline.com/blog/kirkland-wa-housing-market
Writing about this market? Paste this into your post:
<a href="https://resideline.com/blog/kirkland-wa-housing-market">
  <img src="https://resideline.com/images/embed/kirkland-wa.png" alt="Kirkland, WA home sale price distribution, last six months" width="1000" style="max-width:100%;height:auto">
</a>
<p>Source: <a href="https://resideline.com/blog/kirkland-wa-housing-market">Resideline Market Watch</a></p>
The local market statistics in this report are calculated from closed sales tracked by Resideline. Transaction coverage may differ from complete county or municipal records.
Every local market figure on this page is computed from closed sales Resideline tracked in Kirkland over the last six months, and is refreshed when the data is. The closings we track within the Kirkland city limits are not limited to listing-service sales: they also include foreclosure deeds, estate and family transfers, and other off-market sales that portal medians exclude, which is why 28% of the 724 closings in this window never appeared on a listing service, and the median of MLS-listed sales alone was $1,272,500.
Frequently Asked Questions
What is the median home price in Kirkland?
The median sold price in Kirkland over the last 6 months is $1,249,725, measured across 724 closings Resideline tracked.
How many homes sold in Kirkland last month?
Resideline has tracked 90 closed sales in Kirkland in October 2026 so far, out of 724 closings tracked over the last six months. The most recent month keeps filling in for several weeks as closings are recorded, so this count will rise. These are tracked samples of market activity, not official county totals.
What is the typical sale price range in Kirkland?
The middle half of Kirkland sales over the last six months closed between $920,000 and $1,875,000, with a median of $1,249,725.
What is the typical price per square foot in Kirkland?
Among qualifying Kirkland closings Resideline tracked over the last six months, the median sold price per square foot was $645, measured across 723 sales with usable living area. Median is used rather than average because outliers distort the mean.
How should I check whether a Kirkland estimate is well supported?
Look at the comps, not the headline. Because the $920,000 to $1,875,000 band is wider than most markets we track, an estimate can sit comfortably inside the band and still be wrong for the address. Ask whether the comps share property type, size and condition with the subject, and whether they are balanced around $1,249,725 rather than clustered above it.
Run the numbers
- Home appreciation calculator: project what a home here could be worth in 5, 10 or 30 years
- ARV calculator: estimate after repair value from local sold price per square foot
- Real estate deal analyzer: ARV, rent, comps and a max offer for one address
Statewide picture: Washington Housing Market 2026: Prices, Sales & Trends
What could a property in Kirkland be worth?
See value and rent for a real address. The full report comes with a 7-day Pro trial: card required, cancel anytime in the first 7 days.
See this for a real address