Ohio Housing Market 2026: Prices, Sales & Trends
What homes actually sell for in Ohio: a median closed sale price of $259,000 across 93,106 closings Resideline tracked over the last six months, plus the state's largest markets by volume.
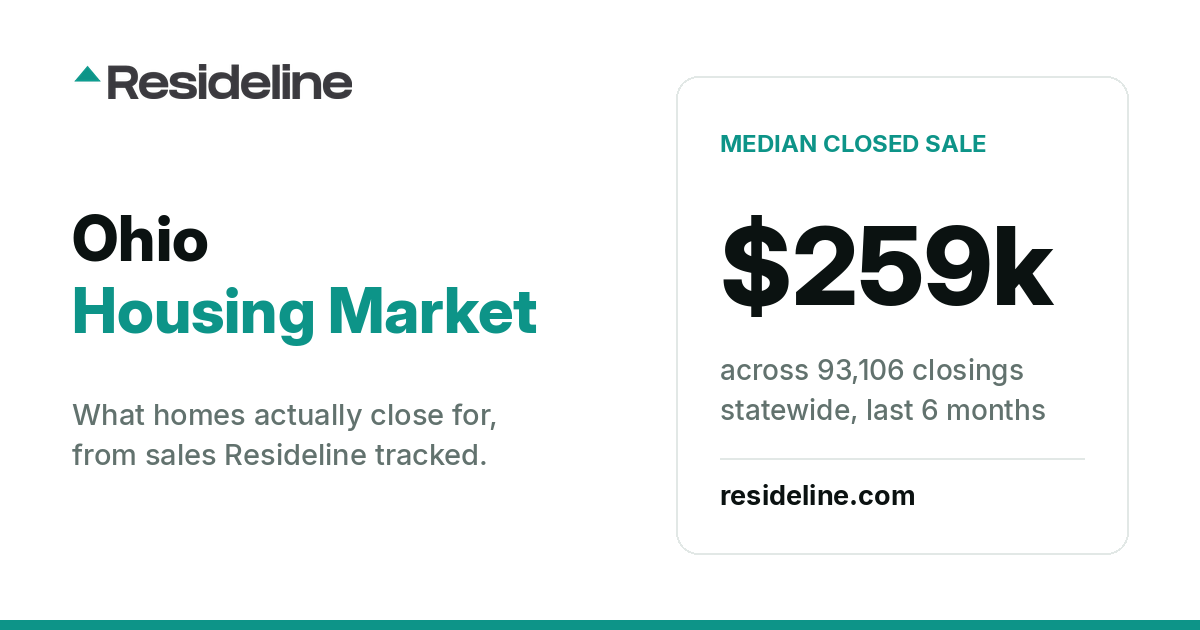
Ohio's median closed sale price is $259,000, measured across 93,106 closings Resideline tracked statewide over the last six months, as of October 2026. These are closings we track directly, a measured sample rather than a complete state record, which is why we can show the detail below at all. A statewide median hides how far apart Ohio's markets sit. Among its highest-volume markets, West Chester carries the highest median and Canton the lowest. That gap is the reason a state figure belongs in a market briefing rather than in an offer: it describes the middle of the distribution, not a price you can underwrite against.
Ohio's largest markets by closing volume
| Market | Closings tracked, last 6 months | Median closed sale |
|---|---|---|
| Columbus | 4,904 | $259,700 |
| Cleveland | 2,879 | $121,000 |
| Cincinnati | 2,229 | $272,200 |
| Toledo | 2,006 | $129,900 |
| Akron | 1,502 | $135,000 |
| Dayton | 1,124 | $134,900 |
| Parma | 619 | $225,000 |
| Canton | 590 | $117,450 |
| West Chester | 516 | $421,000 |
| Grove City | 508 | $379,950 |
Volume matters as much as price here. Higher transaction volume generally provides more potential comparable sales, although the usable set for a specific property still depends on property type, size, condition, location and recency.
Rankings for Ohio: best places to buy rental property in Ohio ranks cities by asking rental yield from tracked sales and rental listings, cheapest cities to buy a house in Ohio adds each city's price per square foot for houses, realized appreciation and days to contract, and Cap Rate by City ranks the Ohio cities Resideline tracks by gross rental yield.
More Ohio research: housing market reports for Miami Twp, Fairborn, Lebanon, Maple Heights, Amherst, and Steubenville.
More Ohio city reports: Amelia · Aurora · Avon Lake · Barberton · Batavia · Beavercreek · Bellefontaine · Blacklick · Bowling Green · Brunswick · Canal Winchester · Chagrin Falls · Chillicothe · Cuyahoga Falls · Elyria · Englewood · Fairfield · Findlay · Franklin · Hilliard · Huber Heights · Kettering · Lancaster · Lewis Center · Maineville · Mansfield · Massillon · Maumee · Mentor · Miamisburg · Middletown · Mount Vernon · New Albany · New Philadelphia · Newark · North Canton · North Olmsted · North Ridgeville · Painesville · Pataskala · Perrysburg · Pickerington · Piqua · Powell · Ravenna · Reynoldsburg · Shaker Heights · Springboro · Stow · Strongsville · Sylvania · Tipp City · Troy · Uniontown · Wadsworth · Westerville · Westlake · Willoughby · Wooster · Xenia · Zanesville.
Figures last updated October 4, 2026 from closings Resideline tracked.
How to price a specific Ohio property
Work from the closings, not from the state number. Start with sales of the same property type inside a tight radius, match size and condition before you widen anything, and treat the figures above as a sanity check on the answer rather than as the answer. A statewide median is useful for spotting which markets deserve attention; it will mis-price an individual address in either direction.
Run any Ohio address through Resideline and you will get the local comparable set and the property's value together, in one report.
Frequently Asked Questions
What is the median home price in Ohio?
The median closed sale price in Ohio is $259,000, measured across 93,106 closings Resideline tracked statewide over the last six months as of October 2026.
Which Ohio markets are most and least expensive?
Among the Ohio markets we track with the most closings, West Chester has the highest median closed sale at $421,000 and Canton the lowest at $117,450. Both are measured from closings Resideline tracked over the last six months.
What could a property in Ohio be worth?
Create a free account to explore a Ohio property's value, rental potential and comparable properties.
Create a free account3 free reports at signup. No card required.