The House Rent Premium Shrinks to About 7% After Matching Bedrooms
Renting a house costs more than renting a comparable non-house unit in most qualifying markets, but far less than the raw numbers suggest. Among 373 postal markets with at least 50 removed 3-bedroom house rental listings and 50 removed 3-bedroom non-house rental listings over the 24 months to July 2026, the median Observed rent for 3-bedroom houses was about 7 percent higher than for 3-bedroom non-house stock (condos, townhomes, and other types). The raw house-vs-non-house gap looks like about 31 percent, but roughly three-quarters of that disappears once you compare same-bedroom rentals, pointing to unit size rather than property type as most of the raw gap (bedroom-matching does not fully isolate size).
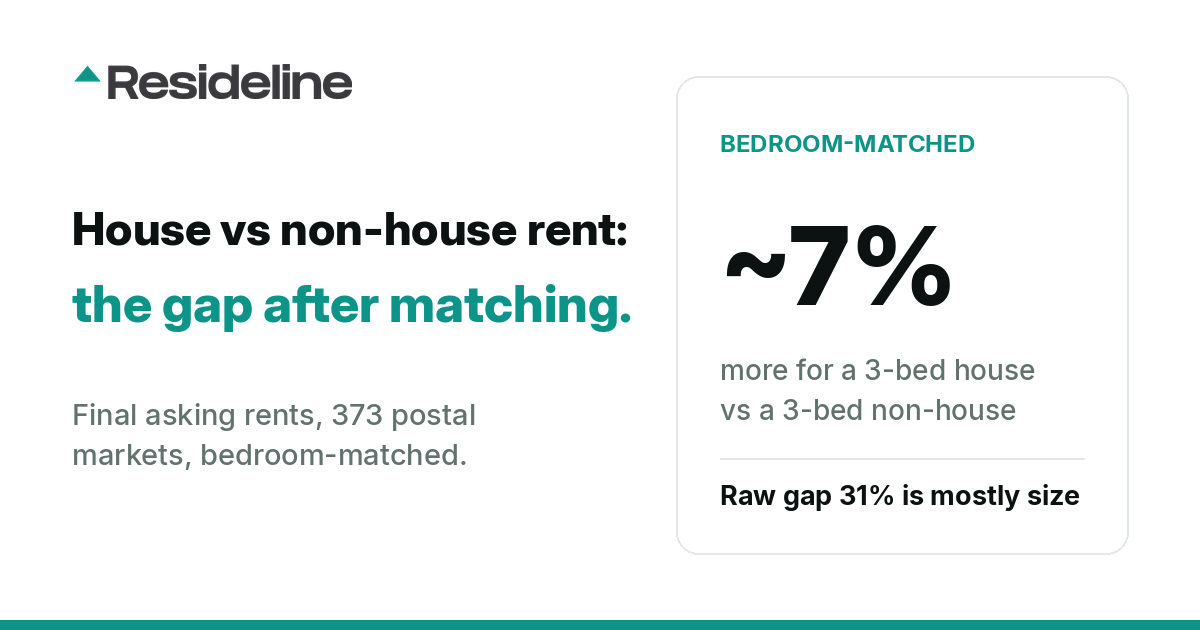
Ask what it costs to rent a house instead of a condo or townhome, and the raw data seems to shout a big number. Across the markets that clear our listing-count gates, the median house rents for roughly 31 percent more than the median non-house unit. But that comparison quietly stacks two different things on top of each other: a house is a different kind of product, and a house is usually a bigger one. Once we match bedroom counts, most of the raw gap disappears.
We narrowed the comparison by matching bedroom count: 3-bedroom houses against 3-bedroom non-house units in the same market. Among 373 qualifying postal markets with at least 50 removed 3-bedroom house rental listings and at least 50 removed 3-bedroom non-house rental listings in the 24 months to July 2026, the median Observed rent for 3-bedroom houses was about 7 percent higher than for 3-bedroom non-house stock (condos, townhomes, and other types). The median market-median rent was about $2,490 for a 3-bedroom house versus about $2,350 for a 3-bedroom non-house unit. The 7 percent is the median of each market's own premium, which runs a little above the ratio of those two headline figures.
The raw gap is real, but it mostly reflects unit size
Three numbers tell the whole story:
- •Raw whole-unit gap: about 31 percent. Across the 598 markets with at least 100 removed house rental listings and at least 100 removed non-house rental listings, the median house rent sat about 31 percent above the median non-house rent. This is the number you get comparing every house against every condo, townhome, and other unit, regardless of size.
- •Same-bedroom gap: about 7 percent. Restrict the comparison to identical bedroom counts and the gap collapses. On the 363 markets where we can measure it both ways, holding bedroom count fixed drops the premium by about 22 percentage points.
- •About three quarters of the raw premium disappears once we match rentals by bedroom count. The evidence suggests unit size explains much of the raw gap, though matching bedroom count does not fully isolate a size effect (a 3-bedroom house still typically has more interior and outdoor space than a 3-bedroom condo).
The bedroom ladder
The bedroom-matched premium grows with the unit, which is itself a clue that size is doing most of the work:
| Bedroom count | House premium vs same-size non-house |
|---|---|
| 2-bedroom | +4.8% |
| 3-bedroom | +7.1% |
| 4-bedroom | +12.6% |
What "about 7 percent" is, and is not
- •It is a bedroom-matched rent difference, not a size-controlled estimate of the type premium. We match on bedroom count, but within a bedroom count a 3-bedroom house still tends to carry more square footage, a yard, and parking than a 3-bedroom condo. Some of the remaining 7 percent is still size and amenity, so the pure property-type premium is at most about 7 percent and probably a little less.
- •The comparison group is non-house stock, not "apartments." The baseline is 3-bedroom condos, townhomes, and other non-house rentals, not a clean apartment-only set. We avoid the phrase "houses rent X percent above apartments" for that reason.
- •It is a market-level comparison, not a specific property's premium. Each market contributes one house median and one non-house median, and the 7 percent is the median across markets. An individual house can lease well above or below its local non-house median, and in more than a fifth of markets there is no premium at all.
How we measured it
- •Data: observed rents, whole-unit monthly: a confirmed lease close where property records hold one, otherwise the final asking rent when the listing left the market. Not live asking rents, not per-bedroom rents, not per-square-foot rents. Observed rent blends confirmed lease closes extracted from property records with the final asking rent on listings that left tracking; the close share is measured in asking rent vs observed rent, an earlier study that analyzes final asking rents under its own definition and says nothing about confirmed lease closes.
- •Window: the 24 months to July 2026.
- •Gate (headline): a market qualifies only if at least 50 3-bedroom house rental listings and at least 50 3-bedroom non-house rental listings left the market in the window. 373 postal markets clear it.
- •Gate (raw comparison): the broader 31 percent figure uses the 598 markets with at least 100 house and 100 non-house rental listings that left the market of any size.
- •Premium: each market's median 3-bedroom house rent versus its median 3-bedroom non-house rent, in percent.
- •Headline statistic: the median of market premiums, so each qualifying market counts once regardless of size.
The coverage caveat
This is not a national number. It covers only markets that clear the listing-count gates, and the qualifying set is geographically concentrated: Florida and California together make up about 38 percent of the 373 qualifying markets. Warm-weather markets with deep single-family and condo rental bases are overrepresented, so read the 7 percent as a finding among qualifying postal markets, not a U.S. average.
Related studies
This premium is what a house costs to rent over other stock; two companion studies look at what owners got out of it. In Did homes beat inflation? we compare each market's long-run realized home-price appreciation against CPI to see where owning outran the dollar. In Cash flow or growth? we cross current gross rental yields with realized appreciation to map which postal markets have historically delivered income, price growth, or both.
Two live studies pair naturally with this one. Our asking rent vs observed rent study found the rent recorded when a listing leaves the market runs above live asking rents in most markets, which is exactly why this article is built on observed rents, confirmed lease closes and final asking rents at the end of a listing's life, rather than on the rents first asked. And if the premium has you thinking like a landlord, the best rental yields in America reports a median-of-markets gross yield of 6.53 percent across 628 gated postal markets, gross meaning before expenses, taxes, vacancy, and management. Remember that a market-wide median rent over median price is a screen for comparing markets, not a specific property's yield or a property-level 1 percent test.
Frequently Asked Questions
How much more does it cost to rent a house than a comparable unit?
Among the 373 qualifying postal markets, the median observed rent for 3-bedroom houses ran about 7 percent above that of 3-bedroom non-house units (condos, townhomes, and other stock) over the 24 months to July 2026, a median of about $2,490 versus $2,350. That 7 percent holds unit size roughly fixed by comparing same-bedroom-count rentals, so it is best read as a bedroom-matched rent difference rather than a size-controlled estimate of the property-type premium: matching on bedrooms does not equalise floor area, neighborhood, condition or amenities.
Isn't the house rent premium much bigger than 7 percent?
The raw, whole-unit gap does look bigger: across 598 qualifying markets the median house rent ran about 31 percent above the median non-house rent. But most of that reflects unit size rather than property type. Restricting the comparison to the same bedroom count collapses the gap to about 7 percent, a drop of roughly 22 percentage points on the markets we can measure both ways, so about three quarters of the raw premium disappears once we match on bedroom count. Matching bedrooms does not fully isolate a size effect (a 3-bedroom house still tends to have more space than a 3-bedroom condo), so unit size explains much of the gap but is not fully proven.
Does a bigger house always mean a bigger premium?
The premium grows with size. Compared against non-house stock at the same bedroom count, 2-bedroom houses led by about 4.8 percent, 3-bedroom by 7.1 percent, and 4-bedroom by 12.6 percent. But the premium is not universal: in about 22 percent of the qualifying 3-bedroom markets, houses carried no premium at all, with the house median at or below the non-house median.
Do these numbers cover the whole country?
No. They cover only postal markets that clear the listing-count gates, and Florida and California together make up about 38 percent of the 373 qualifying markets, so this is a finding among qualifying markets, not a national average. Every figure is built on observed rents, a confirmed lease close where property records hold one and otherwise the last rent asked before a listing left the market, not on live asking rents, and compares whole-unit monthly rents.

About the author
Jeffrey Batista
Jeffrey Batista is the founder of Resideline, a real estate technology company building institutional grade valuation and investment analysis tools for real estate investors.
A software engineer with more than 10 years of experience, Jeffrey has worked across full stack development, infrastructure, data engineering, machine learning, and large scale systems. He left his engineering career to build Resideline full time.
Jeffrey is also a real estate investor with nearly a decade of hands on experience buying, renovating, managing, and analyzing residential properties. His experience on both sides of the industry, as an engineer and an investor, led him to build Resideline after seeing how fragmented and outdated many of the tools available to individual investors were.
Today, he leads the development of Resideline's proprietary data infrastructure, automated valuation models, rental analytics, and investment underwriting technology.
Could the rent make this property work?
Create a free account to review rental comps, model operating costs and explore projected cash flow.
Create a free account3 free reports at signup. No card required.