The Best Rental Yields in America: 628 Cities Ranked by Observed rent
Across the 628 qualifying US postal markets, the median gross rental yield was 6.53 percent over the past 12 months, and the top market, Gary, Indiana, reached 20 percent. We ranked these cities (postal areas) by dividing 12 times the median Observed rent, drawn from roughly 3 million rental listings that left the market, by the median sold home price. It is a market-level gross rent-to-price ratio, a gross-yield proxy, not a property-level yield. No asking-rent inflation, no forecasts.
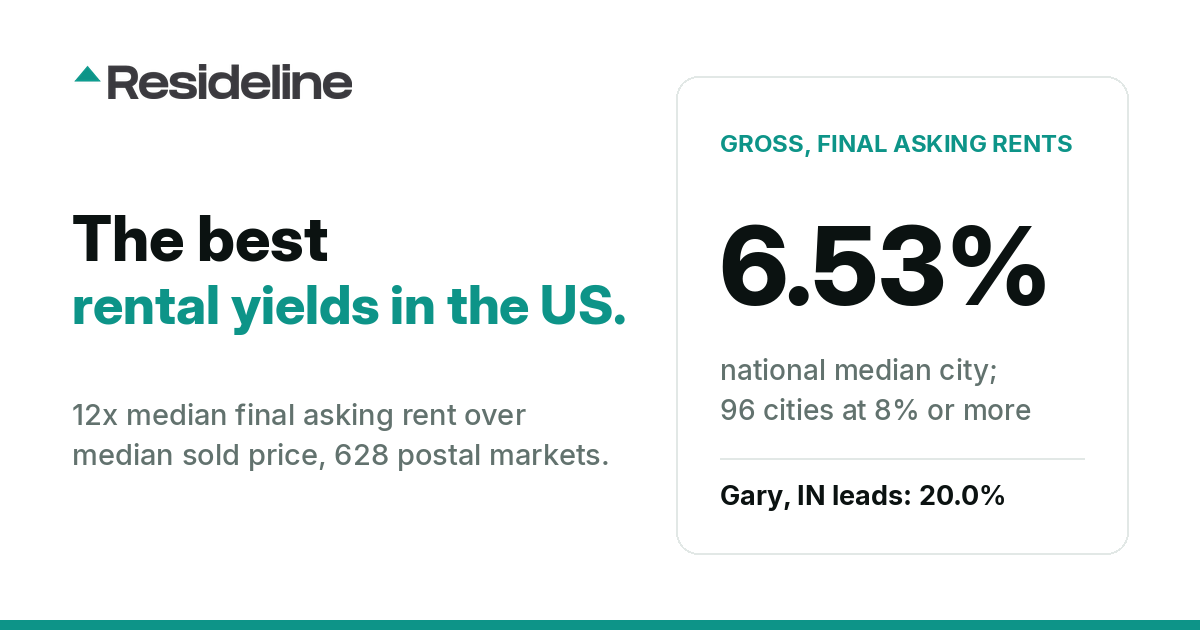
The highest gross rent-to-price ratio among the 628 postal markets we ranked over the last 12 months belonged to Gary, Indiana. Rental listings there left the market asking a median of $1,500 a month while homes sold at a median of $90,000, a gross yield of 20.00 percent. The lowest belonged to Beverly Hills, California, at 2.42 percent. Same country, same 12 months, a spread of more than eight to one.
This ranks markets by their gross rent-to-price ratio (annualized median Observed rent divided by median sold home price), the market-level screen investors use as a gross-yield proxy. It is not a property-level yield: the rent and sale-price mixes differ, and it is gross, before taxes, insurance, vacancy and management.
Most yield rankings are built on asking rents, the number in the listing. This one is built on observed rents, a confirmed lease close where property records hold one and otherwise the final asking rent when a listing left the market, drawn from roughly 3 million rental listings that left the market. That matters. In our companion study of the same corpus, measured on the same 12-month window, the observed rent on removed listings ran 4.6 percent above the current asking rent in the median metro, and only 21 percent of the 1,726 qualifying metros showed the final ask below live asking. Rankings built on live asking rents therefore sit slightly below these in most metros; the two are different observations of the same market.
Across the 628 cities (postal areas) that cleared our data gates, the median gross yield, computed as a median of city medians, was 6.53 percent. 96 of 628 cities (15.3 percent) reached 8 percent or better. Only 9 of 628 (1.4 percent) reached 12 percent.
What we measured
Gross rent-to-price ratio = 12 x median Observed rent / median sold home price. Gross means exactly that: unlevered, before property taxes, insurance, vacancy, management, and repairs. It is a past-window, market-level price-to-rent snapshot, not a property-level yield or a cash-flow promise.
- •Rents are medians of Observed rent on rental listings (removed, deduplicated, confidence-filtered) that left the market in the trailing 12 months. The national corpus kept 2,963,999 rental listings that left the market. Observed rent blends confirmed lease closes extracted from property records with the final asking rent on listings that left tracking; the close share is measured in asking rent vs observed rent, an earlier study that analyzes final asking rents under its own definition and says nothing about confirmed lease closes. Snapshot date: 2026-08-22.
- •Prices are 12-month medians of sold homes: houses, condos, and townhomes. The rent and price windows align to within roughly one week.
- •Gates: a city needed at least 150 rental listings that left the market in the last 12 months and at least 400 closed sales. 628 of 2,191 joined cities (postal areas) qualified.
- •One asymmetry to keep in view: the rent median mixes unit types (houses, condos, apartments) while the price median covers homes. Condo- and apartment-heavy rows are flagged below.
- •A secondary 24-month variant widens coverage to 1,067 cities (median 6.47 percent; 157 of 1,067 at or above 8 percent), but the 12-month basis is the ranking basis throughout.
The top 25 cities (postal areas) by gross yield
Some rows share a metro cluster; rather than capping them, we label them. South Florida holds ranks 4, 7, and 22, and the Cleveland cluster holds ranks 3, 8, and 11.
| # | City (postal area) | Gross yield | Median Observed rent | Median price | rental listings that left the market | Sales | House share | House-only yield | Metro cluster |
|---|---|---|---|---|---|---|---|---|---|
| 1 | Gary, IN | 20.00% | $1,500 | $90,000 | 285 | 989 | 88.4% | 20.00% | Chicagoland (NW Indiana) |
| 2 | Detroit, MI | 17.33% | $1,300 | $90,000 | 2,203 | 7,435 | 67.5% | 17.67% | Detroit (core) |
| 3 | Bedford, OH | 15.18% | $1,790 | $141,500 | 219 | 560 | 94.1% | 15.20% | Cleveland suburbs |
| 4 | Lauderhill, FL | 13.82% | $1,900 | $165,000 | 553 | 1,440 | 29.8% | 19.27%* | South Florida (Broward) |
| 5 | Flint, MI | 13.60% | $975 | $86,000 | 205 | 1,908 | 89.8% | 13.60% | Flint (own metro) |
| 6 | Binghamton, NY† | 12.79% | $1,900 | $178,250 | 187 | 768 | 29.9% | n/a | standalone |
| 7 | Deerfield Beach, FL | 12.77% | $2,475 | $232,500 | 598 | 1,905 | 31.6% | 16.00% | South Florida (Broward) |
| 8 | Euclid, OH | 12.41% | $1,500 | $145,000 | 172 | 666 | 90.7% | 12.41% | Cleveland suburbs |
| 9 | Montgomery, AL | 12.25% | $1,450 | $142,000 | 404 | 1,798 | 79.7% | 12.63% | standalone |
| 10 | Abilene, TX‡ | 11.32% | $2,499 | $265,000 | 221 | 2,522 | 84.6% | 11.32% | standalone |
| 11 | Cleveland, OH | 11.13% | $1,465 | $158,000 | 2,966 | 9,516 | 53.8% | 11.77% | Cleveland (core) |
| 12 | Peoria, IL | 11.08% | $1,200 | $130,000 | 286 | 2,136 | 78.3% | 10.23% | standalone |
| 13 | Toledo, OH | 10.85% | $1,230 | $136,000 | 728 | 4,486 | 73.6% | 11.31% | standalone |
| 14 | Jackson, MS | 10.81% | $1,350 | $149,900 | 432 | 1,316 | 81.2% | 11.21% | standalone |
| 15 | Dundalk, MD | 10.64% | $2,000 | $225,500 | 176 | 741 | 19.3% | n/a | Baltimore suburbs |
| 16 | Decatur, IL | 10.47% | $995 | $114,005 | 198 | 1,461 | 92.4% | 10.53% | standalone |
| 17 | Akron, OH | 10.34% | $1,250 | $145,000 | 648 | 3,529 | 75.9% | 10.34% | Akron (own metro, Cleveland-adjacent) |
| 18 | Rockford, IL | 10.33% | $1,550 | $180,000 | 295 | 2,615 | 70.2% | 11.00% | standalone |
| 19 | Syracuse, NY | 10.33% | $1,850 | $215,000 | 273 | 2,405 | 45.4% | 12.00% | standalone |
| 20 | Florissant, MO | 10.17% | $1,685 | $198,737 | 237 | 1,368 | 88.2% | 10.23% | St. Louis suburbs |
| 21 | Memphis, TN | 10.15% | $1,395 | $165,000 | 2,294 | 8,163 | 80.4% | 10.20% | standalone |
| 22 | Delray Beach, FL | 10.12% | $2,700 | $320,000 | 1,503 | 4,395 | 29.4% | 14.25%* | South Florida (Palm Beach) |
| 23 | Mesquite, TX | 10.11% | $2,400 | $285,000 | 276 | 1,481 | 85.1% | 10.51% | Dallas suburbs |
| 24 | Lansing, MI | 9.94% | $1,350 | $163,000 | 235 | 2,101 | 39.6% | n/a | standalone |
| 25 | Rochester, NY | 9.87% | $1,850 | $225,000 | 622 | 5,463 | 46.3% | 11.73% | standalone |
- •† Binghamton, NY: its final-asking median of $1,900 ran 27 percent above the asking median in the same corpus, on a thin, condo and apartment majority sample (29.9 percent houses; too few removed house rental listings for a house-only check). The pattern fits college-town lease selection. It is the least trustworthy number in the top 10.
- •\* Lauderhill and Delray Beach, FL: the house-only column divides a house-only rent by the mixed homes price (no house-only sold price exists in the sales data), so it overstates yield in condo-heavy cities. Lauderhill reads 19.27 percent house-only against 13.82 mixed; Delray Beach 14.25 against 10.12. We never rank on that column; it is a robustness check only. The n/a rows (Binghamton, Dundalk, Lansing) had fewer than 100 removed house rental listings.
- •‡ Abilene, TX: $2,499 is not a typo. Its rent sample is about 85 percent houses, and an independent asking-house sample corroborates the level at $2,395 (n = 1,370).
More broadly, five of the 25 rows lean on condo and apartment rental listings for their rent median: Dundalk (19.3 percent house share), Delray Beach (29.4), Lauderhill (29.8), Binghamton (29.9), and Deerfield Beach (31.6).
What a real 8 percent market looked like
Across the 628 gated cities, the middle half sat between 5.43 and 7.50 percent; the 10th percentile city yielded 4.46 percent and the 90th percentile 8.47 percent. An 8 percent gross market is real but uncommon: 96 of 628 cities, about one in seven.
The table shows what those markets were: cheap Midwest and rust-belt houses. 22 of the 25 rows carried a median sold home price below $250,000, and the two 17-percent-plus cities both had $90,000 medians. Read the price column before the yield column. A 20 percent gross yield on a $90,000 Gary home is not a 20 percent return: property taxes, insurance, repairs, turnover, and management consume a larger share of a low rent, and gross yield counts none of them. High gross yield is where underwriting starts, not where it ends.
The bottom 10
Nine of the ten lowest-yield cities (postal areas) among the 628 were in California; the tenth was Bellevue, Washington. Median rents there ran $3,000 to $7,200 a month, but against $1.2M to $3.4M prices.
| Rank of 628 | City (postal area) | Gross yield |
|---|---|---|
| 619 | Pasadena, CA | 3.41% |
| 620 | Arcadia, CA | 3.27% |
| 621 | San Clemente, CA | 3.21% |
| 622 | Fremont, CA | 3.14% |
| 623 | Bellevue, WA | 3.06% |
| 624 | Santa Monica, CA | 3.06% |
| 625 | Glendale, CA | 2.88% |
| 626 | Berkeley, CA | 2.78% |
| 627 | Newport Beach, CA | 2.52% |
| 628 | Beverly Hills, CA | 2.42% |
Where the states landed
Rolling cities up to states (median of member-city yields, minimum 5 qualifying cities; 29 states qualified):
| State | Median city yield | Qualifying cities |
|---|---|---|
| Illinois | 9.17% | 10 |
| Pennsylvania | 8.41% | 8 |
| Indiana | 8.32% | 8 |
| Ohio | 8.21% | 13 |
| Michigan | 8.18% | 13 |
| South Carolina | 7.39% | 10 |
| Georgia | 7.36% | 30 |
| Oklahoma | 7.32% | 7 |
| Texas | 7.29% | 51 |
| Florida | 7.14% | 132 |
Every number above is a past-window observation: the last rent listings asked before leaving the market and what homes sold for over one 12-month window. We make no forecasts here.
What these yields mean as cap rates
A gross rent-to-price ratio is the top line, not the profit line. To translate it, apply an operating-expense assumption: implied cap rate = gross ratio x (1 minus the expense ratio), before debt service. Measured city-level operating costs are not in this data, so we show three labeled assumption scenarios spanning typical single-family operating ranges. At a 35 percent expense ratio, the median market's implied cap is 4.24 percent; at 45 percent, 3.59 percent; at 55 percent, 2.94 percent (medians of market medians across the same 628 qualifying markets).
The expense lens also shrinks the club at the top. Of the 96 markets at or above an 8 percent gross ratio, only 12 keep an implied cap above 6 percent under the 45 percent scenario; the breakeven gross ratio at that line is 10.91 percent. The count moves with the assumption, which is the point: at 35 percent expenses, 37 of those 96 markets clear a 6 percent cap; at 55 percent, only 5 do. One honesty note: real expense ratios vary by market, and insurance-heavy Florida likely sits at the high end of that band, which would reorder the Florida rows against the Midwest ones.
Related studies
This ranking is one of three studies built on the same final-asking-rent corpus: Does the 1 Percent Rule Still Work? counts the cities that cleared the classic 1 percent screen, and Rent vs Buy by City measures where Observed rent covered a principal-and-interest mortgage payment. The asking-versus-final-asking gap that motivates our method is quantified in Asking Rent vs Observed rent, and when you are ready to turn a gross yield into a net number, start with How to Calculate Rental Property Cash Flow. For the same gross yield ranked city by city, with the rent and the price behind each figure, see Cap Rate by City.
Frequently Asked Questions
What is a good rental yield in the US right now?
Across 628 US cities (postal areas) with at least 150 rental listings that left the market and 400 closed sales in the trailing 12 months, the median gross yield (a median of city medians) was 6.53 percent as of August 2026. The middle half of cities fell between 5.43 and 7.50 percent, and 96 of 628 (15.3 percent) reached 8 percent. Gross means unlevered and before taxes, insurance, vacancy, and management.
Which US city has the highest rental yield?
Gary, Indiana, at 20.00 percent gross: a $1,500 median Observed rent against a $90,000 median sold home price over the trailing 12 months (285 rental listings that left the market, 989 sales). That is a gross figure on inexpensive housing stock; taxes, repairs, turnover, and management take a larger share of rent at low price points, so the net return is well below 20 percent.
Why rank on observed rents instead of asking rents?
Live asking rents did not systematically overstate observed rents in the companion study: in the median qualifying postal market, the observed rent on removed listings was 4.6% above live asking. In the same rent corpus, measured on the same 12-month window, the observed rent on removed listings ran 4.6 percent above the current asking rent in the median metro, and only 21 percent of the 1,726 qualifying metros showed the final ask below live asking. Yield rankings built on live asking rents therefore sit slightly below rankings built on observed rents in most metros; the two are different observations of the same market.
Is a high gross yield the same as a good investment?
No. This ranking's gross yield is a market-level rent-to-price ratio, 12 times the median Observed rent divided by the median sold home price, unlevered and before property taxes, insurance, vacancy, repairs, and management. Because the rent and sale-price mixes differ, it is not a specific property's yield. Those costs consume a larger fraction of a low rent, so cheap high-yield markets have thinner net spreads than the gross number implies. Treat gross yield as a screening statistic, then underwrite the specific property.

About the author
Jeffrey Batista
Jeffrey Batista is the founder of Resideline, a real estate technology company building institutional grade valuation and investment analysis tools for real estate investors.
A software engineer with more than 10 years of experience, Jeffrey has worked across full stack development, infrastructure, data engineering, machine learning, and large scale systems. He left his engineering career to build Resideline full time.
Jeffrey is also a real estate investor with nearly a decade of hands on experience buying, renovating, managing, and analyzing residential properties. His experience on both sides of the industry, as an engineer and an investor, led him to build Resideline after seeing how fragmented and outdated many of the tools available to individual investors were.
Today, he leads the development of Resideline's proprietary data infrastructure, automated valuation models, rental analytics, and investment underwriting technology.
Could the rent make this property work?
Create a free account to review rental comps, model operating costs and explore projected cash flow.
Create a free account3 free reports at signup. No card required.