Best Places to Buy Rental Property in California (2026)
Twenty California cities ranked by asking rental yield, from 10.2 percent in Seal Beach to 6.5 percent in Perris, using tracked home sales and rental listings; geographic coverage explained below.
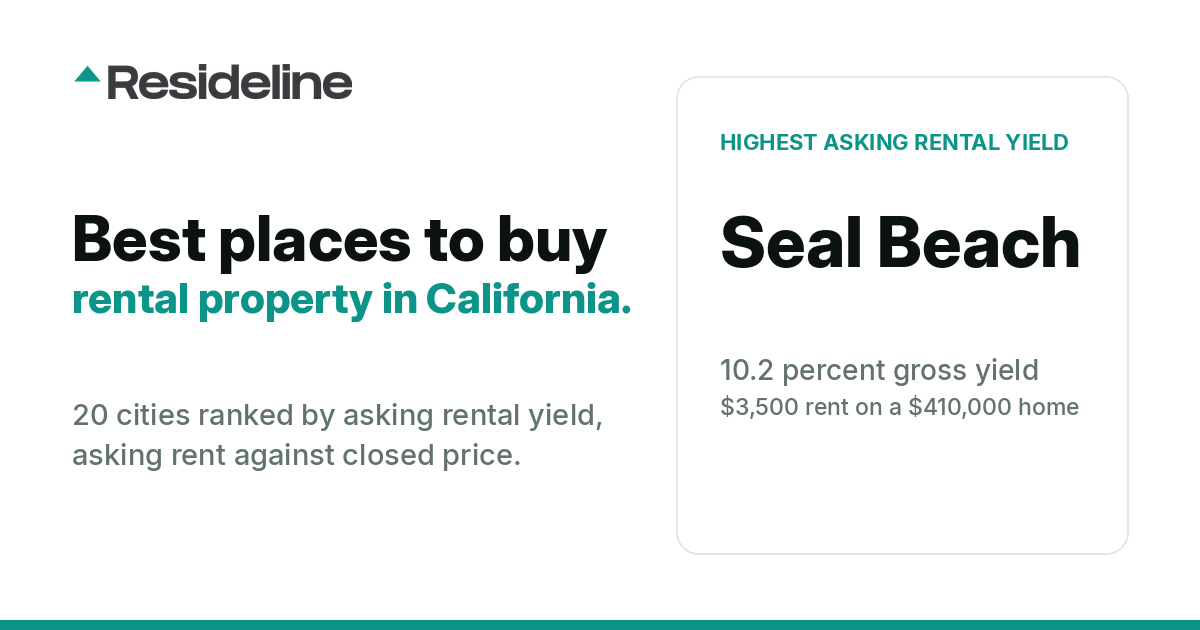
Cheap is not the same as high-yield in California. Barstow has the lowest median price on this list at $274,999 and ranks nineteenth; Seal Beach, where a $410,000 home asks $3,500 a month, ranks first at 10.2 percent gross. Second is Laguna Woods: 8.2 percent gross, $439,000 to buy, $2,990 a month to rent. One caution on the rent side: in La Quinta houses asked a median of $5,375 while the all-type median was $4,000. For a house, compare house rents with house sale prices; substituting the house rent into a ratio whose denominator is a mixed sale median only makes the number look better, not more representative. One caution on Seal Beach: its sales are shaped by Leisure World Seal Beach, an age-restricted stock cooperative, so review ownership type, occupancy requirements and association leasing rules before reading its ratio as an investable yield. Volume and yield part ways: Menifee closes about 155 homes a month, more than any other city here, and ranks seventeenth on yield at 6.6 percent. Measured against the whole state, these are cheap markets: a median of $418,500 here against $725,000 statewide. The table shows the 20 highest-yielding markets among 243 California cities meeting the coverage requirements; the yield range above describes the markets shown.
The ranking
| # | City | Gross yield | Median asking rent | Rentals (12 mo) | Median closed price | Closings | Sales window | Confirmed-close median |
|---|---|---|---|---|---|---|---|---|
| 1 | Seal Beach | 10.2% | $3,500 | 213 | $410,000 | 315 | 6 months | n/a |
| 2 | Laguna Woods | 8.2% | $2,990 | 505 | $439,000 | 329 | 6 months | n/a |
| 3 | Madera | 7.5% | $2,395 | 417 | $385,000 | 183 | 6 months | n/a |
| 4 | Indio | 7.2% | $3,200 | 719 | $530,000 | 557 | 6 months | n/a |
| 5 | Palm Desert | 7.2% | $3,000 | 1,559 | $499,000 | 647 | 6 months | n/a |
| 6 | Lancaster | 7.1% | $2,700 | 1,364 | $455,000 | 886 | 6 months | n/a |
| 7 | Crestline | 7.0% | $2,024 | 216 | $345,000 | 186 | 6 months | n/a |
| 8 | Hemet | 7.0% | $2,100 | 988 | $360,000 | 738 | 6 months | n/a |
| 9 | Palmdale | 6.9% | $2,900 | 1,018 | $505,000 | 722 | 6 months | n/a |
| 10 | Banning | 6.8% | $2,125 | 252 | $373,205 | 416 | 6 months | n/a |
| 11 | Victorville | 6.8% | $2,400 | 1,105 | $425,000 | 791 | 6 months | n/a |
| 12 | Hanford | 6.7% | $2,100 | 587 | $375,250 | 340 | 6 months | n/a |
| 13 | Phelan | 6.7% | $2,300 | 67 | $412,000 | 266 | 12 months | n/a |
| 14 | Beaumont | 6.7% | $2,925 | 348 | $525,000 | 447 | 6 months | n/a |
| 15 | Desert Hot Springs | 6.7% | $2,200 | 562 | $395,000 | 222 | 6 months | n/a |
| 16 | La Quinta | 6.6% | $4,000 | 1,058 | $724,000 | 448 | 6 months | n/a |
| 17 | Menifee | 6.6% | $3,200 | 1,048 | $580,000 | 932 | 6 months | n/a |
| 18 | Tehachapi | 6.5% | $2,000 | 256 | $367,500 | 139 | 12 months | n/a |
| 19 | Barstow | 6.5% | $1,495 | 355 | $274,999 | 164 | 6 months | n/a |
| 20 | Perris | 6.5% | $2,900 | 375 | $536,887 | 294 | 6 months | n/a |
City by city
1. Seal Beach, 10.2 percent gross
Rent is what puts Seal Beach first here; on price alone it would sit ninth of 20. Homes in Seal Beach closed at a median of $410,000 over the last six months and the median asking rent in the last twelve months was $3,500, a gross yield of 10.2 percent. Note: sales here are shaped by Leisure World Seal Beach, an age-restricted stock cooperative. Review ownership type, occupancy requirements and association leasing rules before reading this ratio as an investable yield. Across all property types, homes there closed at a median of about $439 per square foot. The Seal Beach market page carries the monthly figures.
2. Laguna Woods, 8.2 percent gross
Rent is what puts Laguna Woods second here; on price alone it would sit twelfth of 20. The numbers: $439,000 median closed price across 329 closings, $2,990 median asking rent across 505 listings, 8.2 percent gross. Note: sales here are shaped by Laguna Woods Village, an age-restricted community with cooperative and condominium mutuals and leasing approval rules. Review ownership type, occupancy requirements and association leasing rules before reading this ratio as an investable yield. Across all property types, homes there closed at a median of about $406 per square foot. The Laguna Woods market page carries the monthly figures.
3. Madera, 7.5 percent gross
Rent is what puts Madera third here; on price alone it would sit seventh of 20. Homes in Madera closed at a median of $385,000 over the last six months and the median asking rent in the last twelve months was $2,395, a gross yield of 7.5 percent. Across all property types, homes there closed at a median of about $235 per square foot. See the Madera page for the property mix and the price band.
4. Indio, 7.2 percent gross
Rent is what puts Indio fourth here; on price alone it would sit seventeenth of 20. The numbers: $530,000 median closed price across 557 closings, $3,200 median asking rent across 719 listings, 7.2 percent gross. The Indio market page carries the monthly figures.
5. Palm Desert, 7.2 percent gross
Rent is what puts Palm Desert fifth here; on price alone it would sit fourteenth of 20. Homes in Palm Desert closed at a median of $499,000 over the last six months and the median asking rent in the last twelve months was $3,000, a gross yield of 7.2 percent. See the Palm Desert page for the property mix and the price band.
6. Lancaster, 7.1 percent gross
Lancaster ranks sixth on yield but only thirteenth on entry price: the $2,700 median asking rent is doing the work, not a cheap purchase. At $455,000 to buy and $2,700 a month to rent, Lancaster yields 7.1 percent gross on 886 tracked closings. See the Lancaster page for the property mix and the price band.
7. Crestline, 7.0 percent gross
Crestline is cheaper than its yield rank suggests: second on price, seventh on yield, because a $345,000 home there rents for only $2,024. At $345,000 to buy and $2,024 a month to rent, Crestline yields 7.0 percent gross on 186 tracked closings. Full detail is on the Crestline market page.
8. Hemet, 7.0 percent gross
A low entry price does not carry Hemet far: it is third cheapest on this list and eighth on yield, with rent of $2,100 against a $360,000 median price. Homes in Hemet closed at a median of $360,000 over the last six months and the median asking rent in the last twelve months was $2,100, a gross yield of 7.0 percent. Full detail is on the Hemet market page.
9. Palmdale, 6.9 percent gross
Palmdale ranks ninth on yield but only fifteenth on entry price: the $2,900 median asking rent is doing the work, not a cheap purchase. At $505,000 to buy and $2,900 a month to rent, Palmdale yields 6.9 percent gross on 722 tracked closings. The Palmdale market page carries the monthly figures.
10. Banning, 6.8 percent gross
Banning is cheaper than its yield rank suggests: fifth on price, tenth on yield, because a $373,205 home there rents for only $2,125. The numbers: $373,205 median closed price across 416 closings, $2,125 median asking rent across 252 listings, 6.8 percent gross. Across all property types, homes there closed at a median of about $254 per square foot. Full detail is on the Banning market page.
11. Victorville, 6.8 percent gross
The numbers: $425,000 median closed price across 791 closings, $2,400 median asking rent across 1,105 listings, 6.8 percent gross. Across all property types, homes there closed at a median of about $230 per square foot. Full detail is on the Victorville market page.
12. Hanford, 6.7 percent gross
A low entry price does not carry Hanford far: it is sixth cheapest on this list and twelfth on yield, with rent of $2,100 against a $375,250 median price. Homes in Hanford closed at a median of $375,250 over the last six months and the median asking rent in the last twelve months was $2,100, a gross yield of 6.7 percent. Across all property types, homes there closed at a median of about $231 per square foot. Full detail is on the Hanford market page.
13. Phelan, 6.7 percent gross
Only 67 rental listings sit behind Phelan's $2,300 median; the yield is real but less settled than in cities with hundreds. The numbers: $412,000 median closed price across 266 closings, $2,300 median asking rent across 67 listings, 6.7 percent gross. See the Phelan page for the property mix and the price band.
14. Beaumont, 6.7 percent gross
Homes in Beaumont closed at a median of $525,000 over the last six months and the median asking rent in the last twelve months was $2,925, a gross yield of 6.7 percent. Across all property types, homes there closed at a median of about $264 per square foot. See the Beaumont page for the property mix and the price band.
15. Desert Hot Springs, 6.7 percent gross
Desert Hot Springs is cheaper than its yield rank suggests: eighth on price, fifteenth on yield, because a $395,000 home there rents for only $2,200. At $395,000 to buy and $2,200 a month to rent, Desert Hot Springs yields 6.7 percent gross on 222 tracked closings. Across all property types, homes there closed at a median of about $240 per square foot. The Desert Hot Springs market page carries the monthly figures.
16. La Quinta, 6.6 percent gross
La Quinta ranks sixteenth on yield but only twentieth on entry price: the $4,000 median asking rent is doing the work, not a cheap purchase. The numbers: $724,000 median closed price across 448 closings, $4,000 median asking rent across 1,058 listings, 6.6 percent gross. Across all property types, homes there closed at a median of about $363 per square foot. See the La Quinta page for the property mix and the price band.
17. Menifee, 6.6 percent gross
The numbers: $580,000 median closed price across 932 closings, $3,200 median asking rent across 1,048 listings, 6.6 percent gross. Full detail is on the Menifee market page.
18. Tehachapi, 6.5 percent gross
A low entry price does not carry Tehachapi far: it is fourth cheapest on this list and eighteenth on yield, with rent of $2,000 against a $367,500 median price. The numbers: $367,500 median closed price across 139 closings, $2,000 median asking rent across 256 listings, 6.5 percent gross. Across all property types, homes there closed at a median of about $255 per square foot. Full detail is on the Tehachapi market page.
19. Barstow, 6.5 percent gross
Barstow is cheaper than its yield rank suggests: first on price, nineteenth on yield, because a $274,999 home there rents for only $1,495. The numbers: $274,999 median closed price across 164 closings, $1,495 median asking rent across 355 listings, 6.5 percent gross. Across all property types, homes there closed at a median of about $193 per square foot. Full detail is on the Barstow market page.
20. Perris, 6.5 percent gross
Homes in Perris closed at a median of $536,887 over the last six months and the median asking rent in the last twelve months was $2,900, a gross yield of 6.5 percent. The Perris market page carries the monthly figures.
How this ranking is built
- •Cities: every California city where Resideline tracked at least 100 closings inside the municipal boundary in its reporting window (six or twelve months) and at least 50 rental listings under the city's name since November 4, 2025: 243 cities qualify and the table shows the 20 highest-yielding.
- •Prices: the median price homes closed at inside the city limits, from Resideline's tracked closings; the state comparison uses the statewide median of $725,000 across 166,392 closings.
- •Rents: the median advertised rent on rental listings Resideline tracked in the last twelve months, all property types, measured on the listings that carry the city's name (a postal footprint, wider than the city line in some places).
- •Confirmed-close medians: Observed rent blends two kinds of record: confirmed lease closes extracted from property records, and the final asking rent on listings that left Resideline tracking without a recorded close. Where a city has at least 30 confirmed closes in the window, their median is printed beside the asking figure; in the last twelve months about a quarter of Resideline's close episodes are confirmed closes. The asking and confirmed-close samples are separate, not paired, so a difference between their medians is not a measured gap on the same listings.
- •What is missing: taxes, insurance, vacancy, management and repairs, which turn a gross yield into a net one, and the unit mix, which differs between what sells and what rents.
Sources and related pages
- •Resideline tracked closings inside city limits (window per city, updated November 4, 2026) and rental listings since November 4, 2025; confirmed lease closes extracted from property records.
- •More California rankings: Cheapest cities to buy a house in California ranks the same kind of list with each city's price per square foot for houses, realized appreciation and days to contract beside the median, and Cap Rate by City ranks the California cities Resideline tracks by gross rental yield. The California housing market hub carries the statewide figures and the largest California markets by closings.
- •Asking rent vs observed rent compares live asking rents with final asking rents under that study's own definition; it says nothing about confirmed lease closes.
Prepared with Resideline's research pipeline and reviewed by Jeffrey Batista, Resideline's founder.
Frequently Asked Questions
Which California city has the highest asking rental yield?
Seal Beach, at 10.2 percent: a median asking rent of $3,500 against a median closed price of $410,000, on 315 closings and 213 rental listings. Rents and sales are separate samples, so the ratio is a screen rather than a guaranteed return on a given home.
Does the cheapest California city also have the highest asking rental yield?
No. Barstow is the cheapest at $274,999 but ranks nineteenth on the ratio; Seal Beach leads because its asking rent is high relative to its price. The ratio is a screen, not a matched property yield.
Are these asking rents or confirmed lease closes?
The yield column uses the median asking rent on tracked listings. Where a city has at least 30 confirmed lease closes in the window, the table also shows their median, so you can see how far asking sits from closes there. Resideline's close records blend confirmed closes with final asking rents on listings that left tracking, and about a quarter of the last twelve months are confirmed closes.
How many California cities qualify?
243, each with at least 100 tracked closings inside the city limits and 50 rental listings in the last twelve months; the table shows the 20 highest-yielding.

About the author
Jeffrey Batista
Jeffrey Batista is the founder of Resideline, a real estate technology company building institutional grade valuation and investment analysis tools for real estate investors.
A software engineer with more than 10 years of experience, Jeffrey has worked across full stack development, infrastructure, data engineering, machine learning, and large scale systems. He left his engineering career to build Resideline full time.
Jeffrey is also a real estate investor with nearly a decade of hands on experience buying, renovating, managing, and analyzing residential properties. His experience on both sides of the industry, as an engineer and an investor, led him to build Resideline after seeing how fragmented and outdated many of the tools available to individual investors were.
Today, he leads the development of Resideline's proprietary data infrastructure, automated valuation models, rental analytics, and investment underwriting technology.
Run the numbers
- Rental property calculator: cash flow, cap rate, cash-on-cash and DSCR
- Rent estimate calculator: median rent by metro and bedroom count
- Real estate deal analyzer: ARV, rent, comps and a max offer for one address
Could your next California rental work?
See value and rent for a real address. The full report comes with a 7-day Pro trial: card required, cancel anytime in the first 7 days.
See this for a real address