Does a Strong Economy Mean More Affordable Housing?
New lower cost housing grows and shrinks with the economy, federal data from 1960 to 2025 show. The share of income a buyer's payment takes tracks mortgage rates instead.
A downturn usually means fewer new lower cost homes, and whether it makes buying easier depends on mortgage rates. In our payment measure, each 1 point rise in the 30-year rate has gone with about 2.2 more points of median family income going to a new home payment.
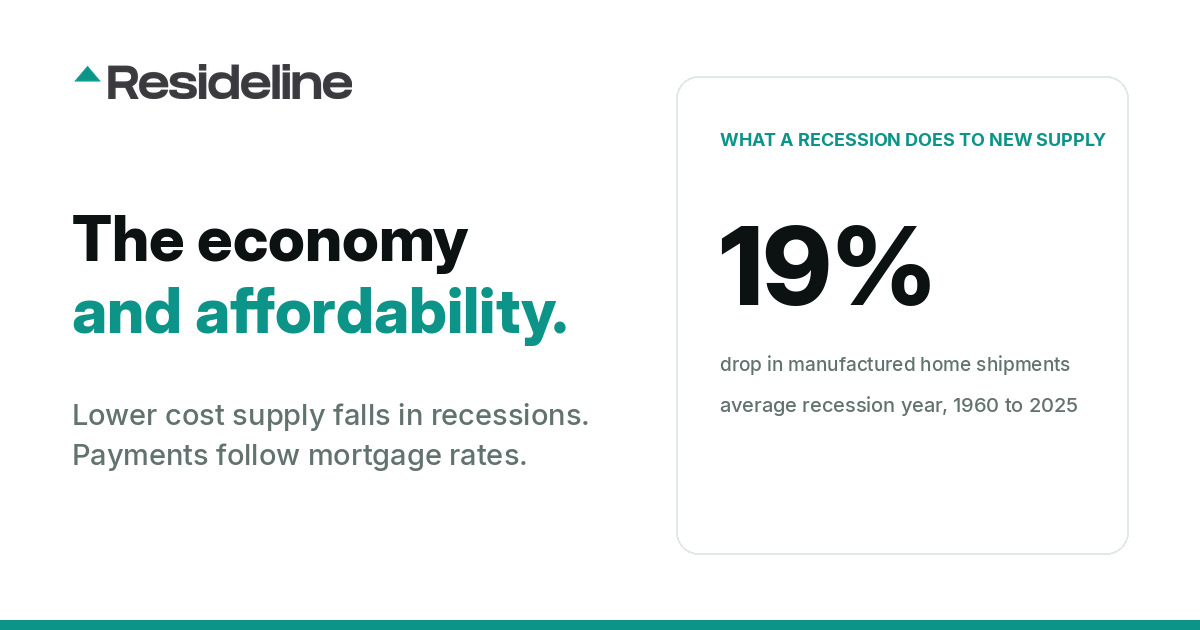
New lower cost housing grows when the economy grows and shrinks in recessions, though a strong economy has not guaranteed a high level of building. We followed three related supply indicators, none of them a pure measure of affordable housing: manufactured homes; apartment starts in buildings with five or more units, a count that includes market rate units along with subsidized ones; and rentals opened under the Low-Income Housing Tax Credit, the main federal subsidy for affordable rentals and, of the three, the one that tracked the economy least. According to the Census Bureau, which counts the first two, manufactured home shipments fell 19% on average in recession years from 1960 to 2025 and grew about 6% in expansion years.
The payment measure is the monthly principal and interest on a new home at the median price of new homes sold, with 20% down, as a share of median family income. Prices and incomes come from the Census Bureau and the 30-year rate from the weekly national mortgage rate survey. In 2020, the year of a two-month recession, the payment took 16.0% of income, the lowest in the series, which starts in 1972. In 2023, with the economy growing, it reached 26.5%, the highest since 1990. The payment share has almost no link to GDP growth, and its link to the job market (a correlation of -0.30) runs through rates, which have usually fallen when unemployment rose.
How closely each measure moved with the economy
A correlation is a score from -1 to 1 that measures how closely two numbers move together. Near 1, they rise and fall in step. Near 0, there is no pattern. A negative score means one tends to rise when the other falls.
From 1960 to 2025, the yearly change in manufactured home shipments and the growth rate of real GDP, which the Commerce Department reports, had a correlation of 0.51 across 66 years. Shipments tended to grow when the economy grew and to shrink when it stalled. GDP growth lines up with about a quarter of the year to year swing in shipments (0.51 squared is 0.26).
| Housing measure, yearly change | Compared with | Years | Correlation | In plain words |
|---|---|---|---|---|
| Manufactured home shipments | Real GDP growth | 1960 to 2025 | 0.51 | Moderate link, same direction |
| Apartment starts, 5+ unit buildings | Real GDP growth | 1960 to 2025 | 0.38 | Weaker link, same direction |
| Tax credit units placed in service | Real GDP growth | 1988 to 2019 | 0.31 | Weak, could be chance |
| Buyer payment as a share of income | Real GDP growth | 1973 to 2025 | 0.18 | Close to none, could be chance |
| Buyer payment as a share of income | Change in the 30-year mortgage rate | 1973 to 2025 | 0.91 | Moves almost in step |
| CPI rent growth minus wage growth (Atlanta Fed wages) | Change in unemployment a year earlier | 1997 to 2025 | -0.49 | Rent growth slows relative to wages the next year |
All rows compare same-year changes except the rent row, which uses the previous year's change in unemployment; periods differ by row. The payment row is partly arithmetic, because the mortgage rate is one input to that measure.
New lower cost housing grows and shrinks with the economy
Manufactured homes and apartment buildings also follow the job market. In years when the unemployment rate rose, as reported by the Bureau of Labor Statistics (BLS), manufactured home shipments and apartment starts tended to fall, with a correlation of about -0.4 for each.
Eight calendar years since 1960 spent at least six months in a recession as dated by the NBER: 1960, 1970, 1974, 1980, 1982, 2001, 2008 and 2009. Manufactured home shipments fell 19% on average in those years and grew about 6% on average in expansion years. Starts in buildings with five or more units fell about 19% on average in the same eight years, though drops of 52% in 1974 and 63% in 2009 drive that average. The median recession year drop was about 10%, and starts rose in 1982.
Smaller houses: a bigger share, fewer homes
Among new single-family homes completed from 2000 to 2025, Census Bureau counts show the share under 1,800 square feet tended to rise in years when unemployment rose. The share was 37.2% in 1999 and 27.9% in 2007, then rose to 33.1% in 2009. The number of those smaller homes still fell by about half, from about 340,000 in 2007 to 172,000 in 2009, because larger homes fell even faster. The share slid to 21.0% by 2015 while the economy expanded, then climbed back to 31.4% in 2025.
Buyer affordability follows mortgage rates
Our payment to income measure takes a year of monthly principal and interest payments on 80% of the median sales price of new homes, at that year's average 30-year mortgage rate, and divides it by median family income. From 1973 to 2025 its yearly change moved almost in step with the change in the mortgage rate and showed close to no relationship with GDP growth. The rate link still held when we left out the 2020 to 2023 swings, and again when we left out the 1979 to 1981 spike.
The largest one-year jump in the series came during an expansion. The economy grew 2.4% in 2022 and unemployment fell, while the average rate went from 3.0% to 5.3% and the payment share rose from 17.4% to 25.0% of income. In 2020 the rate averaged 3.1% and the share fell to 16.0%. The least affordable year in the series was 1981, when rates averaged 16.6% and the payment took 41.3% of median family income.
Recession by recession
| Recession | Years compared | Manufactured home shipments | Apartment starts, 5+ units | Average 30-year rate | Payment as share of income |
|---|---|---|---|---|---|
| 1973 to 1975 | 1973 vs. 1975 | -63% | -74% | 8.0% to 9.0% | 19.1% to 22.2% |
| 1980 and 1981 to 1982 | 1979 vs. 1982 | -14% | -26% | 11.2% to 16.0% | 29.8% to 38.2% |
| 1990 to 1991 | 1989 vs. 1991 | -13% | -57% | 10.3% to 9.2% | 30.5% to 26.4% |
| 2001 | 2000 vs. 2001 | -22% | -3% | 8.1% to 7.0% | 23.4% to 21.4% |
| 2007 to 2009 | 2007 vs. 2009 | -47% | -64% | 6.3% to 5.0% | 23.8% to 18.6% |
| 2020 | 2019 vs. 2020 | -0.5% | -2% | 3.9% to 3.1% | 16.9% to 16.0% |
Sources: Census Bureau (shipments and apartment starts), the weekly national mortgage rate survey (rates) and our payment to income measure. Windows run from one to three years, so longer ones have more room to fall.
In the six recession periods since 1973, counting the back to back 1980 and 1981 to 1982 recessions as one, the average 30-year rate fell in four and rose in two, and the payment share moved with the rate each time. Buyers got no relief in 1973 to 1975 or in the early 1980s. Rates were higher at the end of both periods than at the start, and so was the payment share. The 1973 to 1975 downturn also cut new supply more than any other recession in the table.
Apartment starts fell 57% around the 1990 to 1991 recession, though the 1986 tax reform and the savings and loan crisis also weighed on apartment building in those years. In 2001 shipments fell 22%, but they had been sliding since 1998, as the market for manufactured home loans collapsed. Apartment starts barely moved that year.
The 2007 to 2009 recession was the second deepest in the table for both kinds of building. Over those years the average rate fell from 6.3% to 5.0%, new home prices fell relative to incomes, and the payment share dropped from 23.8% to 18.6%. The lower rate accounts for a little more than half of that drop.
The 2020 recession barely registers in construction. After 2020 the economy kept growing while rates and the payment share climbed. The average rate went from 3.0% in 2021 to 6.8% in 2023. In 2023 the economy grew 2.9% and unemployment averaged 3.6%, yet the payment share reached 26.5% and manufactured home shipments fell 21%. Apartment starts hit their highest level since 1986 in 2022, when rates posted their biggest one-year rise since 1981, then fell 36% by 2024. Our yearly data show no consistent link between rate changes and either kind of building.
Tax credit housing tracks the economy loosely
Rentals built under the Low-Income Housing Tax Credit (LIHTC) follow the economy only loosely from year to year. From 1988 to 2019, the yearly change in tax credit units placed in service, as recorded in HUD's LIHTC database, had a link to GDP growth too weak to separate from chance. Federal law caps the credits each state can award per resident, and a project usually opens two to three years after it receives its allocation, which blurs the link to any one year's economy.
Deep downturns still cut placements, which fell about 20% in both 2008 and 2009 and 38% from 2007 to 2010, from 127,138 units to 78,354. A 2009 Joint Center for Housing Studies report tied that drop to falling investor demand for the credits. HUD's counts from 2020 on are incomplete, so the series here stops in 2019.
Manufactured homes after the lending collapse
Shipments reached a 1990s peak of about 373,000 in 1998, well below the all-time high of about 580,000 in 1973. By 2002 they had roughly halved, to about 169,000, and by 2009 they were near 51,000, down 86% from 1998. The CFPB wrote in 2014 that the decline was "driven to a large extent by the collapse of the secondary market for manufactured-housing loans."
Since 2010, shipments have tracked GDP growth less closely: 0.18 across 16 years, against 0.55 for the 38 years before 1998. Sixteen years with one short recession are too few to say the link has broken, and from 1998 to 2009, the years of the loan collapse, shipments still moved with GDP (0.64). Shipments were about 103,000 in 2025. We cover the segment on its own in our manufactured homes article.
Rent growth slows against wages a year after unemployment rises
Growth in CPI rent of primary residence, a BLS series, tended to slow against wage growth about a year after unemployment rose, and only modestly. The link was moderate using Atlanta Fed wage growth for 1997 to 2025. A longer comparison back to 1965 using average hourly earnings, also from the BLS, showed a weaker link that was no longer reliable once 2020 and 2021 were left out. Average hourly earnings jumped in 2020 because so many low-wage jobs disappeared, which distorts those years.
CPI rent still rose 0.2% (annual average) in 2010, after the 2007 to 2009 recession. Renters fared worse in 2023, a growth year: CPI rent rose 8.0% (annual average), the fastest since 1981 (8.7%), and 6.5% measured December to December. According to NLIHC's summary of a 2025 Joint Center for Housing Studies report, a record 22.6 million renter households, half of all renters, were cost-burdened in 2023.
Official rent figures also run behind the market. A 2022 BLS research paper found that "rent inflation for new tenants leads the official BLS rent inflation by 4 quarters." The one-year delay above was measured in CPI rent, so rents on new leases may show the slowdown around when unemployment rises, a year before the CPI does.
What this means for buyers and investors
These are national patterns, and a local market can differ from them. Our Arizona housing market and Ohio housing market pages each include a section on the state economy and home prices.
- •Buyers should watch mortgage rates more than GDP or job reports. The payment share fell in the 2007 to 2009 and 2020 recessions, when rates fell, and rose in 1973 to 1975 and the early 1980s, when rates rose. For current conditions, see is it a buyer's market right now.
- •New supply has usually shrunk in deep downturns: manufactured home shipments fell 19% on average in recession years, but the short 2020 recession moved them by less than 1%, and apartment starts fell only 3% in 2001. Tax credit placements fell 38% from 2007 to 2010. Developers and investors in lower cost housing should check whether less new supply tightens their local market before counting on it.
- •Landlords should expect official CPI rent growth to slow against wages only modestly, about a year after unemployment rises. Rents on new leases, which lead the CPI by about four quarters, may soften in roughly the same year unemployment climbs. Our rent vs. buy study compares the two costs city by city.
- •Manufactured home shipments have tracked GDP only loosely since 2010, a period too short to rely on either way.
How we measured this
All figures are annual and come from public sources. The Census Bureau publishes manufactured home shipments, starts in buildings with five or more units, the median sales price of new homes sold and median family income. The Commerce Department publishes real GDP, and the BLS publishes the unemployment rate, CPI rent of primary residence and average hourly earnings. The average 30-year rate comes from the weekly national mortgage rate survey, and wage growth from the Atlanta Fed. We downloaded them from the St. Louis Fed's FRED database. Small home shares come from the Census Bureau's counts of completed new single-family homes by floor area, LIHTC counts from HUD's LIHTC database and recession dates from the NBER. October 2025 unemployment, CPI rent and Atlanta Fed wage figures were not published during the federal shutdown, so 2025 figures for those use the months that were.
Correlations are Pearson correlations of yearly changes, 1960 to 2025 (66 years) for shipments and apartment starts. We use changes because raw levels trend over time, and inflation in the 1970s and 1980s distorts dollar figures. A recession year is a calendar year with at least six months of NBER recession, and an expansion year is one with no recession months. The seven years with one to five recession months (1961, 1973, 1975, 1981, 1990, 1991 and 2020) count as neither. The 1990 to 1991 and 2020 recessions never reached six months within one calendar year, so they appear in the table but not in the 19% averages. Each table row compares the last year with little or no recession (1973, 1979, 1989, 2000, 2007 and 2019) with the recession's final year. These correlations do not show that one series causes the other, and the significance tests treat each year as independent of the one before.
The payment to income measure is our own reconstruction from public series, and it is not an official affordability index: principal and interest on 80% of the median sales price of new homes sold, at the year's average 30-year rate, divided by median family income. It covers new homes only and starts in 1972. The rate link was 0.92 with 2020 to 2023 left out and 0.88 with 1979 to 1981 left out. Because the rate is one of the measure's inputs, part of this link is arithmetic; the finding is that changes in new home prices and incomes were usually too small to offset rate moves. The rule of thumb in the opening is the slope of an ordinary least squares fit of the yearly change in the payment share on the yearly change in the 30-year rate, 1973 to 2025 (53 years): 2.23 points of income per point of rate.
LIHTC counts are units by year placed in service, 1988 to 2019. Projects with no placement year (148,345 units) are excluded. The rent measure is growth in the annual average CPI rent of primary residence minus wage growth, with Atlanta Fed wage growth taken as its December 12-month average.
Sources
Frequently Asked Questions
Does a recession make housing more affordable?
In the six recession periods since 1973 (counting the back to back 1980 and 1981 to 1982 recessions as one), it did when mortgage rates fell with it and did not when they rose. In 2020, the year of a two-month recession and low rates, the principal and interest payment on a new home at the median price of new homes sold, with 20% down, took 16.0% of median family income, the lowest in the series, which starts in 1972. In the 1973 to 1975 recession rates rose, and the payment share climbed from 19.1% to 22.2%.
Is more affordable housing built when the economy is strong?
New lower cost housing usually grows when the economy grows and shrinks in recessions, though a strong economy has not guaranteed a high level of building. Census Bureau data for 1960 to 2025 show manufactured home shipments fell 19% on average in recession years and grew about 6% in expansion years. Starts in buildings with five or more units fell about 19% on average in the same recession years, an average driven by steep drops in 1974 and 2009; the median recession year drop was about 10%.
Why does affordability track mortgage rates more than the economy?
The monthly payment moves with the loan rate. From 1973 to 2025, yearly changes in our payment to income measure moved almost in step with changes in the 30-year rate and had close to no link to GDP growth. Commerce Department data show the economy grew 2.9% in 2023, yet the payment took 26.5% of median family income, the highest share since 1990.
What happens to rents in a recession?
Official CPI rent growth tends to slow against wage growth about a year after unemployment rises, and only modestly. CPI rent of primary residence, which the BLS publishes, still rose 0.2% (annual average) in 2010, after the 2007 to 2009 recession. A 2022 BLS research paper found that rents for new tenants lead the official rent measure by about four quarters, so new leases may show the slowdown around when unemployment rises, a year before the CPI does.
Do manufactured home shipments still follow the economy?
Less clearly than before 1998, though the recent record is short. Since 2010, shipment growth has had a correlation of 0.18 with GDP growth across 16 years, against 0.55 for the 38 years before 1998, and it was 0.64 from 1998 to 2009, the years of the loan collapse. Shipments fell 86% from 1998 to 2009, according to the Census Bureau, and the CFPB wrote in 2014 that the decline was "driven to a large extent by the collapse of the secondary market for manufactured-housing loans."
Does tax credit housing get built faster in good times?
Only loosely from year to year. From 1988 to 2019, units placed in service under the Low-Income Housing Tax Credit had a weak link to GDP growth, because federal law caps the credits per resident and projects usually open two to three years after allocation. The 2007 to 2009 downturn still cut placements 38%, from 127,138 units in 2007 to 78,354 in 2010, according to HUD.

About the author
Jeffrey Batista
Jeffrey Batista is the founder of Resideline, a real estate technology company building institutional grade valuation and investment analysis tools for real estate investors.
A software engineer with more than 10 years of experience, Jeffrey has worked across full stack development, infrastructure, data engineering, machine learning, and large scale systems. He left his engineering career to build Resideline full time.
Jeffrey is also a real estate investor with nearly a decade of hands on experience buying, renovating, managing, and analyzing residential properties. His experience on both sides of the industry, as an engineer and an investor, led him to build Resideline after seeing how fragmented and outdated many of the tools available to individual investors were.
Today, he leads the development of Resideline's proprietary data infrastructure, automated valuation models, rental analytics, and investment underwriting technology.
A low price is only the starting point.
Create a free account to compare the asking price with nearby sales and explore the property’s rental potential.
See this for a real address3 free reports at signup. No card required.