Safest Counties in Tennessee: 32 Ranked (2026)
The 32 Tennessee counties where police report enough to the FBI to build a reliable rate, ranked by violent crime, with home prices, asking rents and incomes where available.
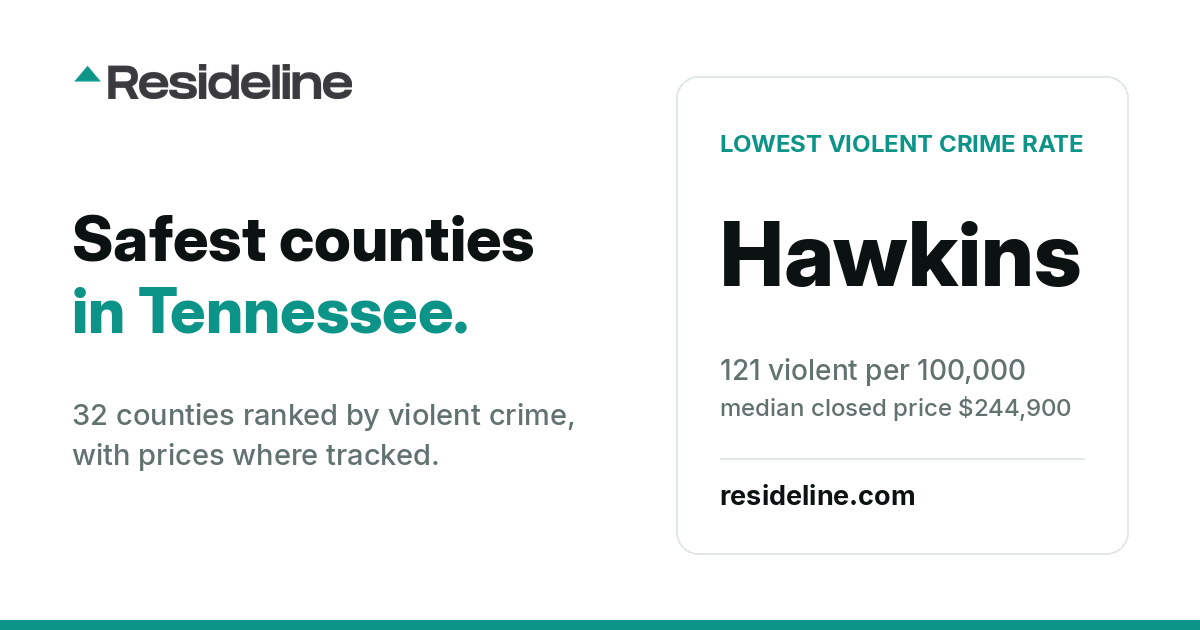
Tennessee has 95 counties. Thirty-two of them clear the reporting bar this page uses, and the gap between the quietest, Hawkins at 121 violent offenses per 100,000, and the busiest, Shelby at 1,329, is 11 to one. What homes closed at over the last 12 months sits beside the rate where Resideline has enough sales to publish a median: 86,247 closing records tracked in the 25 counties that clear that bar.
The crime rates here are built from the 5,598,524 residents those police agencies actually report on, over the months they reported. Each figure is a single county-wide figure, so treat this as a way to narrow a search rather than a verdict on any street.
We do not treat missing or conflicting crime data as zero. A county appears here only when its reporting clears our reliability threshold, and we set aside results that conflict materially with the state's own records. Whether a county is ranked depends on its crime reporting alone; whether it shows a price depends on whether Resideline tracked enough closings there.
The ranking
| # | County | Violent per 100k | Property per 100k | Median closed price | Median asking rent | Median income |
|---|---|---|---|---|---|---|
| 1 | Hawkins | 121 | 543 | $244,900 | $1,000 | $58,842 |
| 2 | Jefferson | 152 | 920 | n/a | n/a | $66,911 |
| 3 | Wilson | 156 | 581 | $510,000 | $2,200 | $96,530 |
| 4 | Sumner | 166 | 458 | $428,675 | $1,900 | $95,878 |
| 5 | Loudon | 169 | 491 | $499,700 | $1,900 | $84,882 |
| 6 | Cumberland | 197 | 888 | n/a | n/a | $63,432 |
| 7 | Roane | 207 | 649 | $272,500 | $1,300 | $77,481 |
| 8 | McMinn | 211 | 1,195 | $259,900 | $1,300 | $61,178 |
| 9 | Putnam | 226 | 1,021 | $330,000 | $1,449 | $61,722 |
| 10 | Blount | 245 | 520 | $385,000 | $1,800 | $78,132 |
| 11 | Robertson | 278 | 697 | n/a | n/a | $81,231 |
| 12 | Carter | 296 | 1,130 | $230,000 | $1,275 | $51,256 |
| 13 | Dickson | 300 | 949 | $354,900 | $1,810 | $75,713 |
| 14 | Gibson | 312 | 868 | $170,000 | $1,100 | $61,163 |
| 15 | Sevier | 314 | 1,282 | $480,000 | $1,809 | $63,315 |
| 16 | Anderson | 314 | 987 | $362,000 | $1,600 | $72,300 |
| 17 | Washington | 324 | 1,462 | n/a | n/a | $64,816 |
| 18 | Bedford | 326 | 953 | $324,900 | $1,495 | $69,879 |
| 19 | Coffee | 333 | 1,403 | $311,500 | $1,450 | $68,092 |
| 20 | Maury | 339 | 1,123 | $440,000 | $2,000 | $82,751 |
| 21 | Rutherford | 354 | 1,267 | n/a | n/a | $90,118 |
| 22 | Greene | 356 | 1,012 | $250,000 | $1,200 | $58,962 |
| 23 | Knox | 378 | 1,401 | $385,000 | $1,900 | $75,465 |
| 24 | Tipton | 382 | 776 | $275,000 | $1,700 | $76,717 |
| 25 | Bradley | 383 | 1,038 | $317,000 | $1,500 | $70,651 |
| 26 | Montgomery | 397 | 1,136 | n/a | n/a | $78,956 |
| 27 | Sullivan | 403 | 1,463 | n/a | n/a | $65,634 |
| 28 | Hamblen | 442 | 1,353 | $285,500 | $1,535 | $60,725 |
| 29 | Hamilton | 447 | 2,028 | $365,000 | $1,695 | $78,271 |
| 30 | Madison | 577 | 2,038 | $265,000 | $1,425 | $63,628 |
| 31 | Davidson | 976 | 3,923 | $464,843 | $2,252 | $80,803 |
| 32 | Shelby | 1,329 | 3,830 | $235,000 | $1,458 | $65,005 |
A closer look at the 12 safest counties
1. Hawkins County
At 121 violent offenses per 100,000, Hawkins sits in the lowest quarter of the places on this list. That is below the median comparable US county, which records 245. A median closing price of $244,900 puts it at roughly 75 percent of the middle figure for this list. It lands in the bottom quarter for crime and the bottom quarter for price at the same time, which few counties manage. Local incomes go further here than almost anywhere else on this list, with homes at 4.2 times median household income. Property crime is low too, at 543 per 100,000, the bottom quarter of this list and 0.5 times the median comparable US county.
2. Jefferson County
Jefferson's violent crime rate is 152 per 100,000 residents, the lowest quarter among the Tennessee counties Resideline can measure. That is below the median comparable US county, which records 245. Its property rate, 920 per 100,000, sits in the middle of these counties.
3. Wilson County
Wilson records 156 violent offenses per 100,000 residents, which places it in the lowest quarter of the Tennessee counties measured here. That is below the median comparable US county, which records 245. Homes changed hands at a median $510,000, around 157 percent of what the rest of this list recorded. Safe and expensive is the usual pairing on this list, and this is one of its clearest cases. Measured against local pay it is one of the harder counties on this list to buy into, at 5.3 times median household income. Its property rate is also among the lowest here, 581 per 100,000, or 0.5 times the median comparable US county. For prices at street level, see Lebanon, the market with the most tracked closings in this county's ZIP codes.
4. Sumner County
Police in Sumner reported 166 violent offenses per 100,000 people, putting it in the lowest quarter of this list. That is below the median comparable US county, which records 245. A median closing price of $428,675 puts it at roughly 132 percent of the middle figure for this list. Safety and price line up here in the way people expect, which is not true of every county on this list. Median household income is $95,878, roughly 136 percent of the level across this list. Property crime is low too, at 458 per 100,000, the bottom quarter of this list and 0.4 times the median comparable US county. Resideline publishes a separate page for Gallatin, the market with the most tracked closings in this county's ZIP codes.
5. Loudon County
At 169 violent offenses per 100,000, Loudon sits in the lowest quarter of the places on this list. The median comparable US county records 245, so it is quieter than most of the country too. Buyers there paid a median of $499,700, some 154 percent of the level across the counties measured. Low crime and high prices arrive together here, which is the arrangement buyers assume is universal and is not. Buying there takes 5.9 times the median household income, a heavier lift than most of this list. Property crime is low too, at 491 per 100,000, the bottom quarter of this list and 0.4 times the median comparable US county. For prices at street level, see Loudon, the market with the most tracked closings in this county's ZIP codes.
6. Cumberland County
Cumberland's violent crime rate is 197 per 100,000 residents, the lowest quarter among the Tennessee counties Resideline can measure. The median comparable US county records 245, so it is quieter than most of the country too. Property offenses run at 888 per 100,000, in the middle of this list.
7. Roane County
Police in Roane reported 207 violent offenses per 100,000 people, putting it in the lowest quarter of this list. That is below the median comparable US county, which records 245. The median home closed at $272,500, roughly 84 percent of the middle figure for these counties. Local incomes go further here than almost anywhere else on this list, with homes at 3.5 times median household income. Property crime is low too, at 649 per 100,000, the bottom quarter of this list and 0.5 times the median comparable US county. The median rental listing asks $1,300 a month.
8. McMinn County
McMinn records 211 violent offenses per 100,000 residents, which places it in the lowest quarter of the Tennessee counties measured here. That is close to the median comparable US county, which records 245. Homes changed hands at a median $259,900, around 80 percent of what the rest of this list recorded. Low crime is not being charged for here, which is the combination most buyers are actually hunting for. Its property rate, 1,195 per 100,000, sits in the middle of these counties. Asking rents run about $1,300 a month. Resideline publishes a separate page for Athens, the market with the most tracked closings in this county's ZIP codes.
9. Putnam County
Police in Putnam reported 226 violent offenses per 100,000 people, putting it in the middle range of this list. That is close to the median comparable US county, which records 245. The median closed price, $330,000, sits near the center of the counties measured. Buying there takes 5.3 times the median household income, a heavier lift than most of this list. Property offenses run at 1,021 per 100,000, in the middle of this list. The median rental listing asks $1,449 a month. For prices at street level, see Cookeville, the market with the most tracked closings in this county's ZIP codes.
10. Blount County
Blount's violent crime rate is 245 per 100,000 residents, the middle range among the Tennessee counties Resideline can measure. That is close to the median comparable US county, which records 245. Buyers there paid a median of $385,000, some 118 percent of the level across the counties measured. Its property rate is among the lowest here, 520 per 100,000, or 0.4 times the median comparable US county. The median rental listing asks $1,800 a month. Resideline publishes a separate page for Maryville, the market with the most tracked closings in this county's ZIP codes.
11. Robertson County
At 278 violent offenses per 100,000, Robertson sits in the middle range of the places on this list. That is close to the median comparable US county, which records 245. Households there earn a median of $81,231, about 116 percent of the median for these counties. Its property rate is among the lowest here, 697 per 100,000, or 0.6 times the median comparable US county.
12. Carter County
Police in Carter reported 296 violent offenses per 100,000 people, putting it in the middle range of this list. That is 1.2 times the median comparable US county, which records 245, though still below the Tennessee statewide rate of 581 per 100,000 in the same data. A median closing price of $230,000 puts it at roughly 71 percent of the middle figure for this list. Median household income is $51,256, roughly 73 percent of the level across this list. At $1,275 a month in asking rent, the gross return here is in the top quarter of the counties measured. Its property rate, 1,130 per 100,000, sits in the middle of these counties. For prices at street level, see Elizabethton, the market with the most tracked closings in this county's ZIP codes.
Does safety set the price in Tennessee?
There is a gap here that income alone does not close. The safest third of these counties runs 19 percent above the highest-crime third on price, while earning only 1 percent less. Our national model needs density as well as income to explain gaps like this one, and this page does not test density, so treat the rest as unexplained rather than as a crime premium.
It is the same pattern our national study found across 688 counties, where crime stopped predicting prices once income was accounted for. The method is set out in our study, Does Crime Actually Lower Home Prices?.
That is a county-level result. Within a county, research at the scale of a block or a neighborhood finds that violent crime does lower the value of the homes nearest to it, so use these figures to compare counties, not streets.
Where safety and affordability overlap in Tennessee
Four of the 10 safest counties on this list also cost no more than the list's median once prices are set against local incomes: Hawkins (121 violent per 100,000, a home at 4.2 times median household income); Sumner (166 violent per 100,000, a home at 4.5 times median household income); Roane (207 violent per 100,000, a home at 3.5 times median household income); McMinn (211 violent per 100,000, a home at 4.2 times median household income). Against what households there earn, those are the counties where a low crime rate is not being charged for.
The large counties
Three counties here have more than 500,000 residents. Their median violent rate is 976 per 100,000 against 314 for the smaller counties on the list, and the quietest of them is Knox at 378. It closes homes at a median of $385,000.
The counties we cannot rank
Larger Tennessee places are missing from the table above. Every one with more than 150,000 residents is listed here with the reason.
- •Williamson, with about 269,000 residents, reports 87 percent of its population through the FBI program, below the 90 percent we require.
Reporting to the FBI is voluntary and incomplete. Where a place's agencies cover only part of its population, the rate is built on the part that reported, so it describes those communities rather than the whole area. We publish at 90 percent coverage or better, which is a line we chose rather than a point where the data becomes reliable.
How to read this list
These figures describe whole areas. A quiet town and a rough district an hour apart carry the same number here, so the ranking is a starting point for a search rather than a description of any particular street.
Prices and rents are as of September 9, 2026, from closings and rental listings Resideline tracks over the previous 12 months; a price is shown where at least 100 closings were tracked and a rent where at least 50 listings were. Rent figures are the median asking rent on listings, not lease figures. Crime is the 2025 FBI Crime Data Explorer release, measured for the whole county over the months each agency reported, and violent crime means murder, rape, robbery and aggravated assault. Household income is the Census SAIPE 2024 estimate of the county's median household income; population is the Census 2024 estimate. Where this page compares a rate with the median comparable US county, that figure (245 violent and 1188 property offenses per 100,000) is the median across the 874 US counties with at least 50,000 residents whose agencies reported on 90 percent or more of them for the year.
Sources and related pages
- •Crime: FBI Crime Data Explorer, agency-level offense counts for 2025, aggregated by county over the months each agency reported.
- •Income: Census SAIPE 2024, county median household income.
- •Population: Census county population estimates, vintage 2024.
- •Prices and rents: Resideline's tracked closings and rental listings, 12 months to September 2026.
- •Related: Safest counties by state; Does crime actually lower home prices?; Tennessee housing market; Safest counties in Alabama; Safest counties in Arkansas; Safest counties in Georgia; Safest counties in Kentucky; Safest counties in Mississippi; Safest counties in Missouri; Safest counties in North Carolina; Safest counties in Virginia.
Prepared with Resideline's research pipeline and reviewed by Jeffrey Batista, Resideline's founder.
Frequently Asked Questions
What is the safest county in Tennessee?
Of the 32 Tennessee counties measured here, Hawkins County records the lowest violent crime rate at 121 offenses per 100,000 residents, against 245 for the median comparable US county. Homes there closed at a median of $244,900 over the last 12 months.
Is this every county in Tennessee?
No. It covers 32 of the state's 95 counties, the ones where police agencies report at least 90 percent of the population to the FBI, the area has at least 50,000 residents, and the resulting rate falls inside the sanity bounds we apply. Whether Resideline has enough sales there decides only whether a price is shown. The larger places that miss those bars are listed on the page with the reason.
Does a lower crime rate mean higher home prices?
Here the price gap is larger than the income gap, so income alone does not explain the raw difference. Comparing the safest third of these counties with the highest-crime third, the median closed price is 19 percent higher and household income 1 percent lower. Across 688 US counties we found that once income and other county characteristics are controlled for, a county's crime rate stops predicting its home prices. At the scale of a block, the research says violent crime does lower nearby values.
Is this crime rate for my neighborhood?
No. The FBI publishes these figures for whole counties, so every part of a county carries the same number here, from its densest district to its farmland. It is useful for narrowing a search and not a substitute for looking at a specific address.
Are these rents asking rents or lease rents?
They are the median asking rent on rental listings in the county over the last 12 months. That is what landlords advertised, a guide to the market rather than a lease figure.

About the author
Jeffrey Batista
Jeffrey Batista is the founder of Resideline, a real estate technology company building institutional grade valuation and investment analysis tools for real estate investors.
A software engineer with more than 10 years of experience, Jeffrey has worked across full stack development, infrastructure, data engineering, machine learning, and large scale systems. He left his engineering career to build Resideline full time.
Jeffrey is also a real estate investor with nearly a decade of hands on experience buying, renovating, managing, and analyzing residential properties. His experience on both sides of the industry, as an engineer and an investor, led him to build Resideline after seeing how fragmented and outdated many of the tools available to individual investors were.
Today, he leads the development of Resideline's proprietary data infrastructure, automated valuation models, rental analytics, and investment underwriting technology.
Considering a property in Tennessee?
Create a free account to check property value, rental potential and comps in the area you are researching.
Create a free account3 free reports at signup. No card required.