How Much Will My House Be Worth in 10 Years? The 3 Percent Rule Ran Well Below the Historical Median
A common rule of thumb assumes roughly 3 percent a year for home appreciation. Measured against 5,014,557 repeat-sale pairs across the 3,124 qualifying US postal markets, the median market posted 5.27 percent a year in realized appreciation (the median of city medians): compounded over ten years, that is $501,142 on a $300,000 home, with the middle half of markets spanning $468,125 to $541,323, versus $403,175 at 3 percent. We matched consecutive sales of the same homes, so this is what actually happened, not a forecast.
Ask ten homeowners what their house gains in value each year and most will land on the same number: about 3 percent. It shows up in retirement spreadsheets, rent-versus-buy debates, and the back of every napkin. So we checked it against what homes actually did.
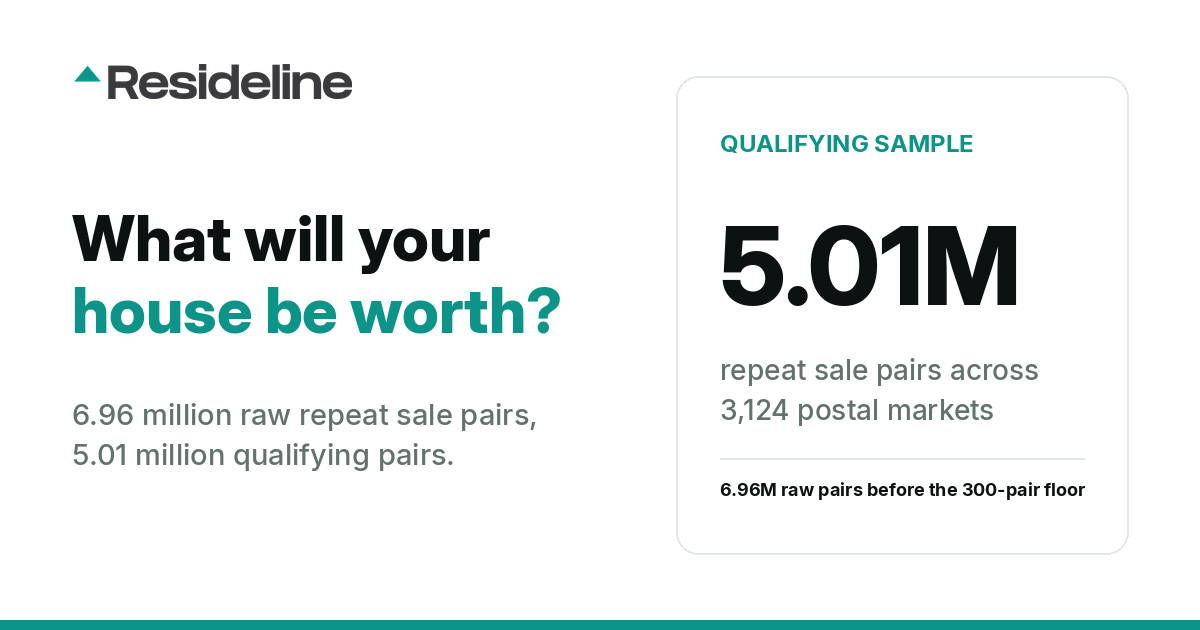
Resideline identified approximately 6.96 million repeat-sale pairs overall. After applying the minimum 300-pair market threshold, 5,014,557 pairs across 3,124 qualifying postal markets formed the final city-level analysis sample. Each pair is a matched set of consecutive sales of the same home. Across that qualified sample, the median market posted 5.27 percent annualized realized appreciation (exact 5.265, median of city medians). The folk 3 percent assumption was not just low. It ran well below the historical median.
Compounding turns that gap into serious dollars. A $300,000 home growing at 3 percent reaches $403,175 in ten years. If the next ten years repeated the measured median rate, the same home would reach $501,142, with the middle half of cities spanning $468,125 to $541,323. That is a difference of $97,967, about 24.3 percent, from a 2.27-point difference in the assumed rate.
One thing this article will not do is forecast. Nobody can tell you what your house will be worth in 10 years, and anyone quoting a single confident number is guessing. What we can tell you, precisely, is what homes did. Then you can decide whether the next decade rhymes.
The 3 percent rule ran low in 99.6 percent of cities
Across the 3,124 qualifying cities (postal areas), 3,111, or 99.6 percent, delivered a median realized rate above 3 percent a year, and 1,843 cities, 59.0 percent, came in above 5 percent. Two caveats ride with that claim in the same breath: a repeat-sales measure only sees homes that sold at least twice, and cities below the 300-pair floor are invisible to this cut, so the qualified sample skews toward larger postal cities.
The middle half of cities ranged from 4.55 to 6.08 percent a year (p25 to p75), with the 10th percentile at 4.01 percent and the 90th at 6.84 percent. Even a pessimistic city draw historically beat the folk rule.
The $300,000 question, at measured rates
The table below is illustrative compounding of a historical realized rate, in nominal future dollars. It answers "what if the future repeated the measured past," never "what will happen." Dollar figures are computed from the unrounded 5.265 percent.
| Scenario (annual rate) | 5 years | 10 years | 20 years |
|---|---|---|---|
| Folk rule: 3.00% | $347,782 | $403,175 | $541,833 |
| p25 of city medians: 4.55% | $374,750 | $468,125 | $730,469 |
| Median of city medians: 5.27% | $387,741 | $501,142 | $837,146 |
| p75 of city medians: 6.08% | $402,985 | $541,323 | $976,768 |
And "nominal" is doing real work in that sentence. None of these rates are inflation-adjusted. At about 3 percent CPI, the measured 5.27 percent a year is roughly 2.2 percent a year in real purchasing power, and every dollar figure above is nominal future dollars, not present-day wealth. The folk 3 percent rule is itself a nominal rule of thumb, which means that in real terms it implies almost no gain in purchasing power at all.
What we measured
For every home in our sold corpus (houses, condos, townhomes) that closed at least twice, we computed the annualized price change between consecutive sales, on holds of 1 to 30 years, with no recency window. The data therefore includes the 2020-2022 run-up alongside older, slower regimes. Each city's figure is the median of those annualized changes, and the figure across qualifying markets is the median of city medians (unweighted), so tiny Bushkill, PA counts exactly as much as Miami, FL with its 31,847 pairs. A pooled-pair median, weighting every pair equally, is a different number and is not derivable from this snapshot, which stores only per-city medians.
The raw corpus: 6,963,756 repeat-sale pairs (matched consecutive sales of the same home), snapshot dated 2026-08-14. The qualified analysis sample behind every ranking and median in this article is the 5,014,557 pairs, about 72 percent of the raw total, that sit in the 3,124 cities (postal areas) with at least 300 pairs each. Twelve states are absent entirely, largely non-disclosure states: AK, ID, KS, LA, MO, MS, MT, ND, NM, TX, UT, WY. These qualifying markets exclude them.
One reconciliation note: our published real home appreciation study reports a 5.19 percent median under a stricter qualification gate covering 1,472 areas. This article uses the wider cut, 3,124 cities (postal areas) at 300-plus pairs, and lands at 5.27 percent. Both round to about 5.2 percent a year; the gates differ, so the numbers do too.
Your city matters far more than the cross-market median
Realized rates across the qualifying cities (postal areas) ran from 1.49 to 11.36 percent a year, a spread no single blanket assumption can paper over.
Top cities (postal areas) by realized annual appreciation:
| City (postal area) | Annual rate | Repeat-sale pairs |
|---|---|---|
| Bushkill, PA | 11.36% | 364 |
| Lewiston, ME | 11.27% | 404 |
| Tobyhanna, PA | 11.02% | 785 |
| Waterville, ME | 10.14% | 403 |
| Opa Locka, FL | 10.03% | 402 |
| Auburn, ME | 9.92% | 315 |
| Steamboat Springs, CO | 9.91% | 932 |
| East Orange, NJ | 9.82% | 629 |
| City (postal area) | Annual rate | Repeat-sale pairs |
|---|---|---|
| New York, NY | 1.49% | 7,501 |
| Macomb, IL | 2.16% | 361 |
| Center Point, AL | 2.35% | 2,431 |
| South Holland, IL | 2.54% | 549 |
| Richton Park, IL | 2.58% | 314 |
The state table
State figures are the median of city medians within each state, gated at five or more qualifying cities.
| State | Annual rate | Cities (postal areas) | Repeat-sale pairs |
|---|---|---|---|
| Maine | 8.83% | 10 | 5,066 |
| New Hampshire | 6.51% | 19 | 13,000 |
| Rhode Island | 6.36% | 20 | 20,830 |
| Wisconsin | 6.23% | 57 | 65,481 |
| North Carolina | 5.99% | 138 | 200,610 |
| Indiana | 5.99% | 68 | 77,779 |
| Arizona | 5.98% | 60 | 245,696 |
| Washington | 5.90% | 97 | 155,165 |
| Tennessee | 5.89% | 101 | 173,205 |
| Florida | 5.74% | 250 | 832,729 |
So how much will your house be worth in 10 years?
Honestly: unknown, and we will not pretend otherwise. Past appreciation is not a promise, the measured window includes an unusually hot stretch, and repeat-sales data only sees homes that sold twice. What the data supports is a conditional statement: if the next ten years repeated the measured median, a $300,000 home would reach about $501,142 in nominal dollars, with the middle half of cities spanning $468,125 to $541,323, versus $403,175 under the folk 3 percent rule. The single biggest upgrade you can make to that estimate is swapping the cross-market median for your own city's realized rate, which is exactly what our free appreciation calculator does.
Related studies
This article is part of a four-study series from the same closed-sale corpus: Where Flippers Buy Houses at a Deep Discount, What a Fixer-Upper Really Sells For: The 20.5% As-Is Discount, Measured in 580 Cities, and The Fixer-Upper Pipeline Map: Distress-Heavy Cities Posted 3.5x the Flip Margins.
Frequently Asked Questions
How much will my house be worth in 10 years?
No one can forecast that reliably, and this study does not try. What measured data shows: across the 3,124 qualifying postal markets, the median market posted 5.27 percent a year (median of city medians, nominal, from matched consecutive sales of the same homes). If the next ten years repeated that rate, a $300,000 home would reach $501,142, with the middle half of markets spanning $468,125 to $541,323. Under the common 3 percent assumption it would reach $403,175.
Is 3 percent a year a realistic home appreciation assumption?
Historically it ran well below what homes did. In 3,111 of 3,124 qualifying postal markets (99.6 percent), the median realized rate exceeded 3 percent a year, and the median across those markets (median of city medians) was 5.27 percent. These are nominal rates measured from homes that sold at least twice, in postal markets with at least 300 repeat-sale pairs each, so the sample skews toward larger postal cities.
Do these home appreciation numbers account for inflation?
No. Every rate in the study is nominal. At about 3 percent CPI, the measured 5.27 percent a year works out to roughly 2.2 percent a year in real purchasing power, and all dollar projections are nominal future dollars rather than present-day wealth.
How is realized home appreciation measured?
By matching consecutive sales of the same home (repeat-sale pairs) and annualizing the price change between them, on holds of 1 to 30 years. This study drew on 6,963,756 repeat-sale pairs, with rankings covering the 5,014,557 pairs in cities (postal areas) that had at least 300 pairs each, snapshot dated 2026-08-14. It measures what happened historically, never a forecast, and only includes homes that sold at least twice.

About the author
Jeffrey Batista
Jeffrey Batista is the founder of Resideline, a real estate technology company building institutional grade valuation and investment analysis tools for real estate investors.
A software engineer with more than 10 years of experience, Jeffrey has worked across full stack development, infrastructure, data engineering, machine learning, and large scale systems. He left his engineering career to build Resideline full time.
Jeffrey is also a real estate investor with nearly a decade of hands on experience buying, renovating, managing, and analyzing residential properties. His experience on both sides of the industry, as an engineer and an investor, led him to build Resideline after seeing how fragmented and outdated many of the tools available to individual investors were.
Today, he leads the development of Resideline's proprietary data infrastructure, automated valuation models, rental analytics, and investment underwriting technology.
What is your property worth today?
Create a free account to review current comps and model your property’s potential returns.
Create a free account3 free reports at signup. No card required.