What a Fixer-Upper Really Sells For: The 20.5% As-Is Discount, Measured in 580 Cities
In Birmingham, AL, distress-classified homes sold at a median of $51.7 per square foot against a citywide median of $145.9. We measured that gap in the 580 U.S. cities (postal areas) with at least 50 distress-classified closed sales over 12 months: distress-marketed and poor-condition homes sold a median of 20.5 percent under the citywide median price per square foot, and tightening the sample only deepens the number.
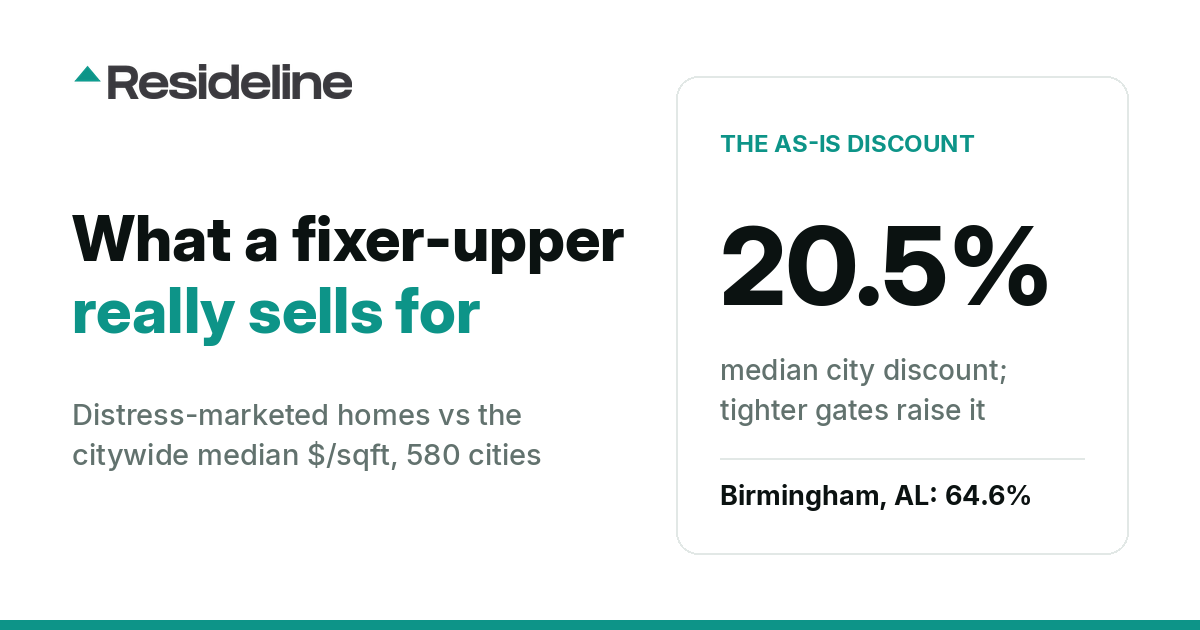
In Birmingham, Alabama, the median home sale over the past year closed at $145.9 per square foot. The median distress-classified sale, the as-is listings, the fixers, the homes marketed as needing work or cash only, closed at $51.7. That is a 64.6 percent gap, the deepest among the 580 qualifying postal markets, and it is not a small-sample fluke: Birmingham logged 312 distress-classified sales inside 6,610 closed sales.
We measured the same gap in every U.S. city (postal area) with at least 50 distress-classified closed sales over the 12 months ending August 14, 2026. Across the 580 cities (postal areas) that qualified, distress-marketed and poor-condition homes sold a median of 20.5 percent under the citywide median price per square foot. That figure is a median of city medians, not a pooled national number, and the middle half of the 580 cities falls between an 11.2 percent and a 30.4 percent price gap.
Here is the part that surprised us: 20.5 percent is the conservative end. Raise the qualifying bar to 100-plus distress-classified sales and the median price gap climbs to 23.0 percent (216 cities). At 150-plus it is 25.6 percent (129 cities). Cities with heavy distress volume tend to be cheap markets with a wide gap between their best and worst housing stock, so every tightening of the gate deepens the number. We quote the floor.
The 10 deepest as-is price gaps
| Rank | City (postal area) | As-is price gap | Citywide $/sqft | Distress $/sqft | Distress sales | All sales |
|---|---|---|---|---|---|---|
| 1 | Birmingham, AL | 64.6% | $145.9 | $51.7 | 312 | 6,610 |
| 2 | Altoona, PA | 60.7% | $79.3 | $31.2 | 63 | 734 |
| 3 | Saginaw, MI | 59.2% | $92.4 | $37.7 | 98 | 1,630 |
| 4 | Elmira, NY | 59.1% | $86.6 | $35.4 | 75 | 515 |
| 5 | Macon, GA | 57.4% | $105.5 | $44.9 | 219 | 2,307 |
| 6 | Shreveport, LA | 55.9% | $118.1 | $52.1 | 200 | 2,524 |
| 7 | Rocky Mount, NC | 55.8% | $123.4 | $54.6 | 58 | 858 |
| 8 | New Orleans, LA | 54.2% | $200.2 | $91.7 | 259 | 3,692 |
| 9 | Gadsden, AL | 53.5% | $121.8 | $56.6 | 57 | 714 |
| 10 | Pittsburgh, PA | 52.7% | $171.6 | $81.2 | 305 | 7,883 |
The geography is unmistakable. Among the 25 deepest cities, Louisiana and Indiana place three each, and Alabama, Pennsylvania, Michigan, New York, Ohio, and Mississippi place two each: a Rust Belt and Deep South list. These are low-cost markets with an unusually wide spread between their cheapest and most expensive homes. The 25 deepest cities carry a mean internal price spread of 2.09 versus 1.54 for the rest of the field, and Birmingham has the single widest spread of all 580. In markets like these, the distress-classified bucket includes near-uninhabitable shells that traded close to land value. The gap is real, and the homes sold for those dollars. But it is a mix effect, not a buyable discount on a normal home.
Where the price gap nearly disappears
At the other end of the table the price gap shrinks to almost nothing, and in a few cities it inverts. Among cities (postal areas) with at least 100 distress-classified sales, these are the shallowest:
| City (postal area) | As-is price gap | Distress sales |
|---|---|---|
| Riverside, CA | -3.0% | 100 |
| Fredericksburg, VA | -2.7% | 121 |
| Alexandria, VA | -2.4% | 167 |
| Silver Spring, MD | +0.3% | 199 |
| Zephyrhills, FL | +0.8% | 214 |
| Panama City Beach, FL | +1.9% | 101 |
| Bristol, CT | +2.2% | 100 |
| Bridgeview, IL | +2.7% | 141 |
| Hyattsville, MD | +3.3% | 135 |
Notice where the shallow side lives. Of the 25 shallowest cities, six are in Virginia and three in Maryland, most of them Washington, DC suburbs, postal areas of one true metro. In high-priced markets where the lot and the location carry most of the value, condition moves the price per square foot far less than it does in Birmingham.
The price gap is not a coupon
The claim this data supports is exactly this: distress-marketed and poor-condition homes sold 20.5 percent under the citywide median dollars per square foot. The claim it does not support, and that no one should sell you, is that you save 20.5 percent by buying as-is.
These are genuinely worse homes: smaller, older, rougher. In 305 of the 580 cities, the distress-classified median sits below the city's own 25th-percentile price per square foot, and that is true in all ten cities on the deep list above. Nothing here compares like homes with like homes; it records what actually sold, at what price.
The distress-classified group is defined by listing language: a sale qualifies if the listing carried distress-marketed wording such as as-is, fixer, TLC, handyman or investor special, needs work, cash only, or full rehab. The classifier looks for a stored condition score first and would accept a score of 2 or below, but no closed sale in this corpus carries one, so in practice every distress-classified sale qualified through its listing text. The phrase estate sale was also on the list in this edition; the caveat under What we measured sizes that exposure. It is the same class our Renovation Premium study calls unrenovated. That study found renovated homes commanded a 45.1 percent median premium per square foot over unrenovated stock across the 191 city-limits metros with at least 50 classified sales in each bucket. The two figures describe the two sides of the same repair gap, but they are computed on different city sets at different gates, so resist the urge to multiply them together; the medians do not compose.
For an investor, the practical question is never the citywide gap. It is the spread between one specific home's as-is price and its after-repair value, minus the renovation budget that connects them, and that spread is where deal math most often goes wrong. We wrote about exactly that failure mode in ARV vs as-is value: why your deal calculator is lying.
What we measured
Metric. For each city (postal area), the as-is price gap is the citywide median price per square foot minus the distress-classified median price per square foot, expressed as a percentage of the citywide median. The headline figure is the median of the 580 city medians, never a pooled figure.
Classification. Distress-marketed listing language (as-is or sold as is, fixer, TLC, handyman special, investor special, needs work, cash only, gut renovation, full rehab, bring your contractor, and, in this edition, estate sale), matched case-insensitively on word boundaries. A stored condition score of 2 or below would also qualify, but no sale in the corpus carries a score, so the classification is text-only in practice.
Scope and window. Closed home sales: houses, condos, and townhomes, with land, mobile and manufactured homes, and commercial excluded. The window is the 12 months ending August 14, 2026 (snapshot generated 2026-08-14), drawn from 4,907,807 closed sales scanned. A city qualified with at least 50 distress-classified sales; 580 cities (postal areas) passed.
One caveat on that list: the exact phrase estate sale qualified on its own in this edition, and an estate sale describes who is selling rather than the condition of the house (probate wording on its own never qualified). We measured the exposure over the same window: 7,006 closed sales mention an estate sale, about two thirds of them alongside explicit condition language, leaving roughly 2,500 sales, 1.2 percent of the 207,026 text-classified distress sales, that qualified on that phrase alone. In the ten deepest cities above, 6 of roughly 1,650 distress-classified sales qualified that way; removing them leaves six of the ten discounts unchanged and deepens the other four by 0.2 to 1.5 points, so the headline does not move. The next edition drops estate wording as a standalone signal; it will count only alongside repair or as-is language.
What the baseline includes. The citywide median includes the distressed sales themselves, so the gap against move-in-ready stock alone is slightly larger than the numbers printed here.
Coverage skew. The 580 qualifying cities account for 54.6 percent of the sales in the corpus, and they skew cheaper than the excluded cities (median price per square foot of $191 versus $216). They also run more distress-heavy than the typical market: our Distress Language Index, built from the same 4,907,807 closed-sale descriptions, puts the median metro distress-language share at 3.21 percent. The 20.5 percent headline describes the cities where distress sales are common enough to measure, not every U.S. market.
Framing. Everything above is realized and historical: these homes sold at these prices in this window. Nothing in this study is a forecast, and no inventory or demand data was used anywhere in it.
Related studies
This article is part of a four-study series from the same closed-sale corpus: Where Flippers Buy Houses at a Deep Discount, How Much Will My House Be Worth in 10 Years? The 3 Percent Rule Ran Well Below the Historical Median, and The Fixer-Upper Pipeline Map: Distress-Heavy Cities Posted 3.5x the Flip Margins.
Frequently Asked Questions
How much less do as-is and fixer-upper homes sell for?
Across the 580 U.S. cities (postal areas) with at least 50 distress-classified closed sales in the 12 months ending August 14, 2026, distress-marketed and poor-condition homes sold a median of 20.5 percent under the citywide median price per square foot (a median of city medians). Tightening the sample deepens the figure: 23.0 percent among cities with 100-plus distress sales and 25.6 percent at 150-plus, so 20.5 percent is the conservative end.
Does buying a home as-is save you 20 percent?
No. The 20.5 percent figure is the gap between what distress-classified homes actually sold for and the citywide median, not a like-for-like saving on a comparable home. These are genuinely worse, smaller, older homes: in 305 of the 580 cities measured, the distress-classified median price per square foot sits below the city's own 25th percentile. Closing the condition gap takes a renovation budget, and renovation and transaction costs come out of any spread.
Which city has the biggest as-is discount?
Birmingham, AL. Distress-classified homes there sold at a median of $51.7 per square foot against a citywide median of $145.9, a 64.6 percent gap, on 312 distress-classified sales out of 6,610 closed sales in the 12-month window. The deepest-gap list clusters in the Rust Belt and Deep South, in low-cost cities with a wide spread between their cheapest and most expensive homes.
What counts as a distressed or as-is sale in this study?
A closed sale was distress-classified if the listing used distress-marketed language such as as-is, fixer, TLC, handyman or investor special, needs work, cash only, or full rehab. In this edition the phrase estate sale also qualified on its own, which affects about 1 percent of the group and none of the headline figures. A stored condition score of 2 or below would also qualify, but no sale in the corpus carries a score. It is the same group our Renovation Premium study calls unrenovated, and the corpus covers closed sales of houses, condos, and townhomes, excluding land, mobile and manufactured homes, and commercial.

About the author
Jeffrey Batista
Jeffrey Batista is the founder of Resideline, a real estate technology company building institutional grade valuation and investment analysis tools for real estate investors.
A software engineer with more than 10 years of experience, Jeffrey has worked across full stack development, infrastructure, data engineering, machine learning, and large scale systems. He left his engineering career to build Resideline full time.
Jeffrey is also a real estate investor with nearly a decade of hands on experience buying, renovating, managing, and analyzing residential properties. His experience on both sides of the industry, as an engineer and an investor, led him to build Resideline after seeing how fragmented and outdated many of the tools available to individual investors were.
Today, he leads the development of Resideline's proprietary data infrastructure, automated valuation models, rental analytics, and investment underwriting technology.
Check the numbers behind your next renovation deal.
Create a free account to inspect sale comps, model repair costs and work through your maximum offer.
Create a free account3 free reports at signup. No card required.