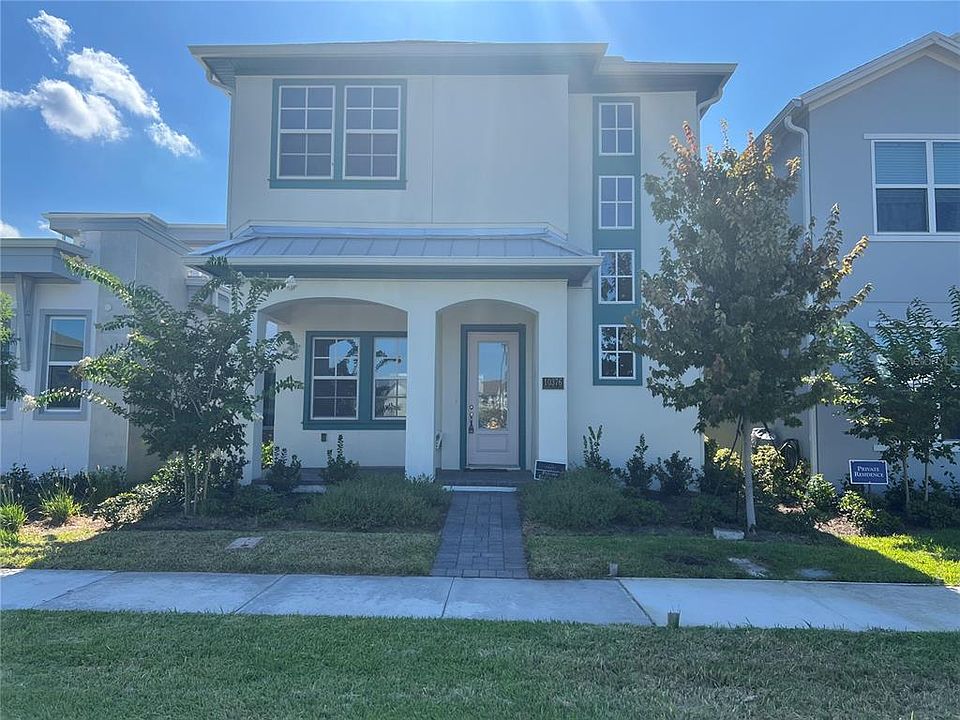
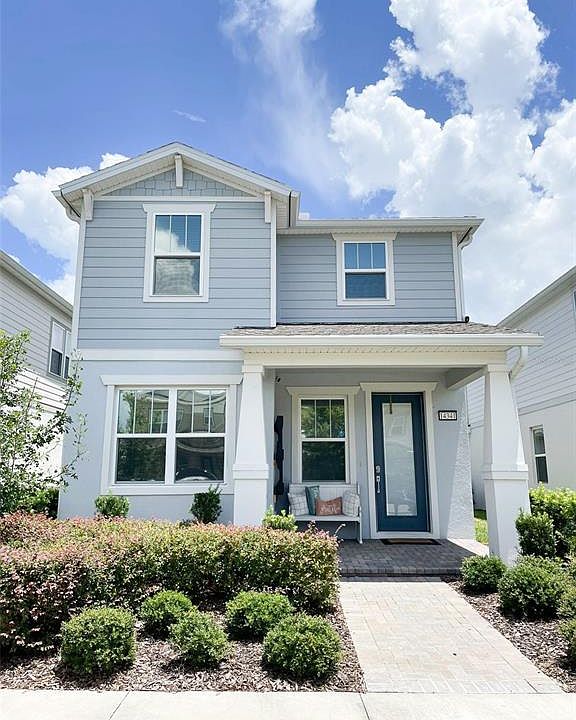
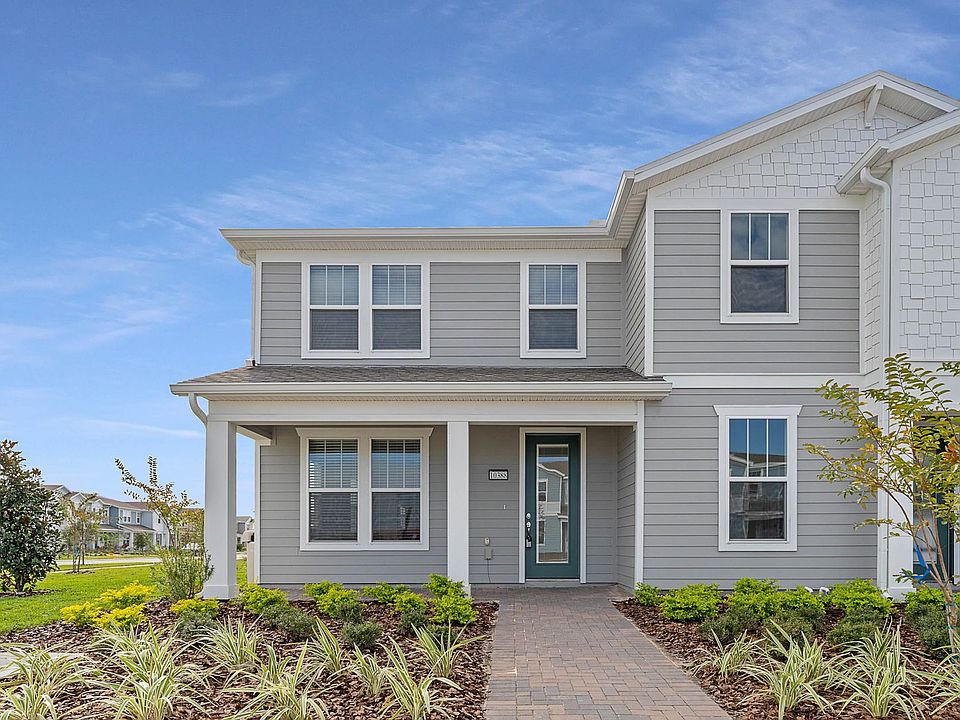
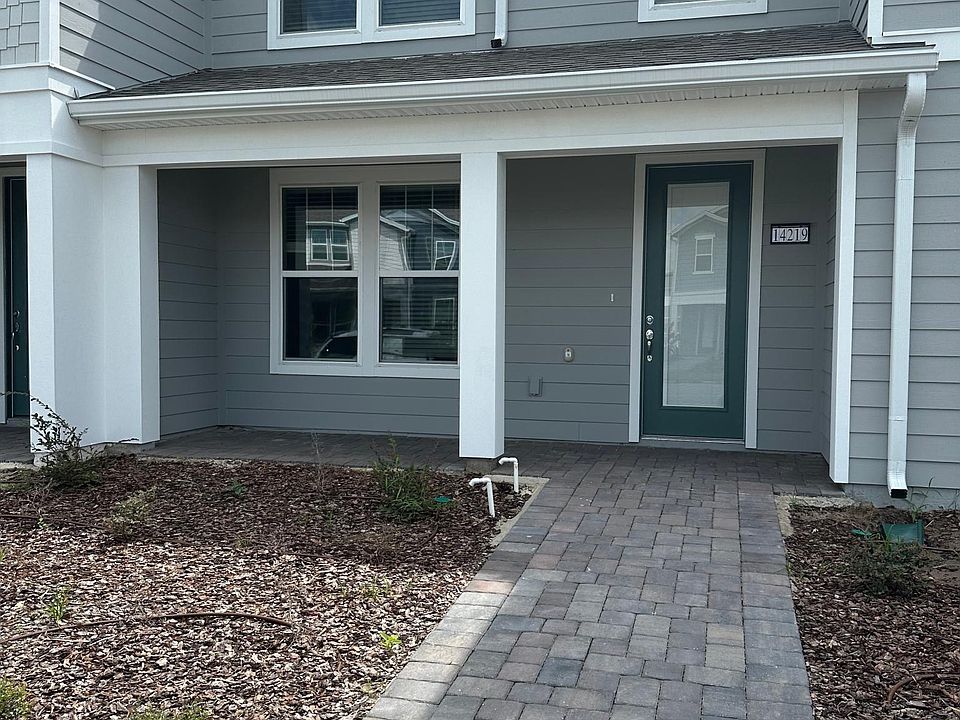
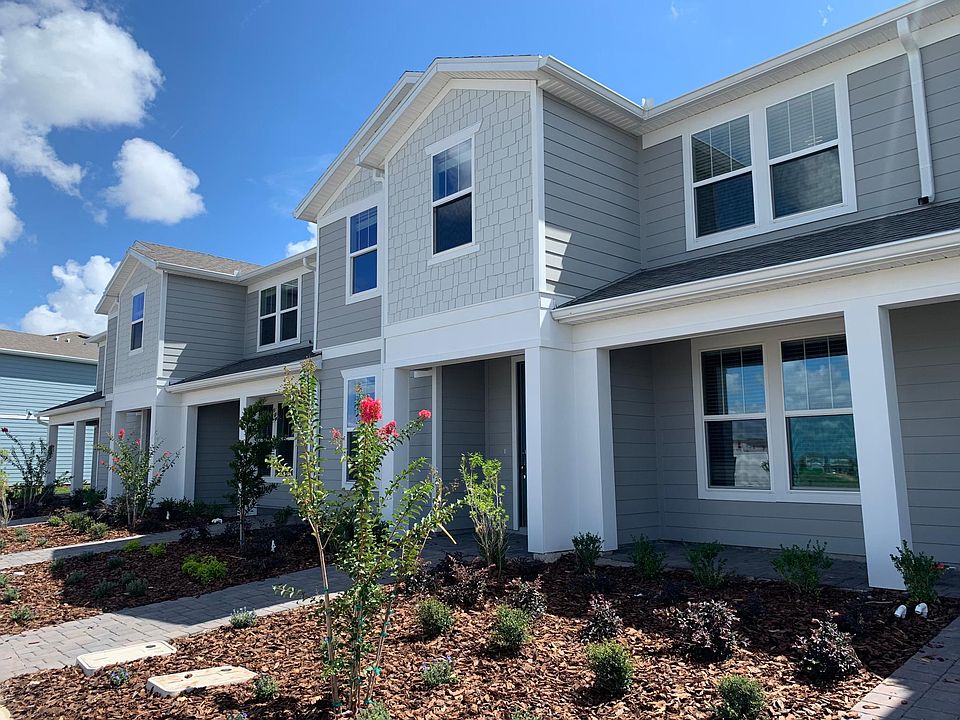
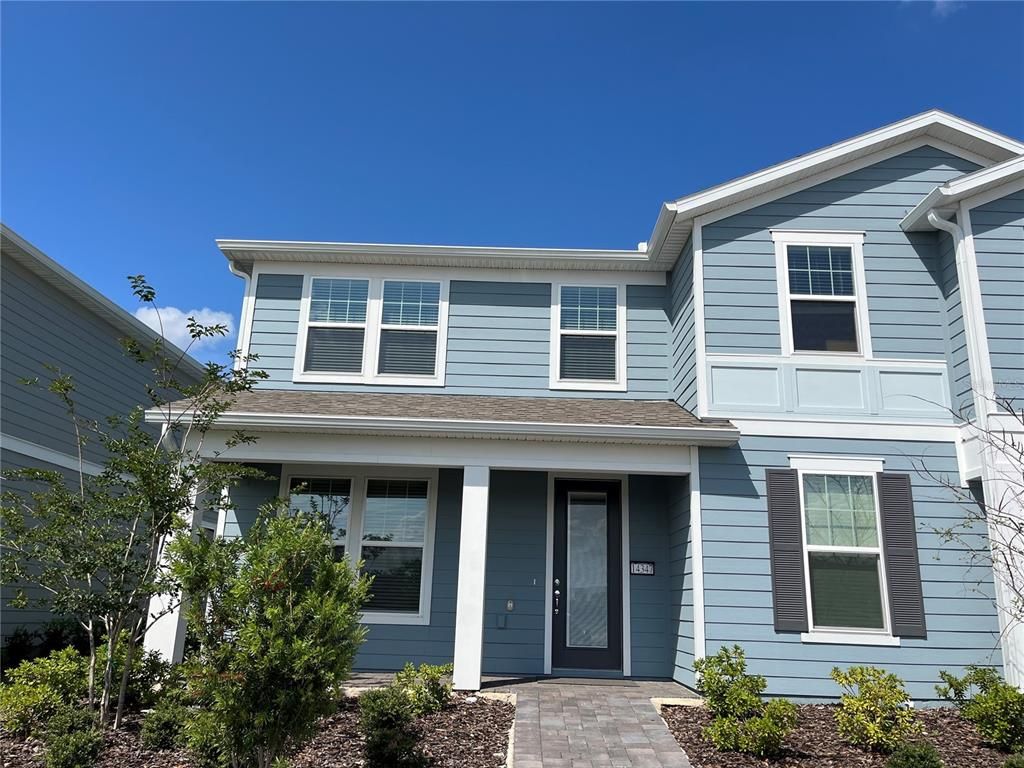
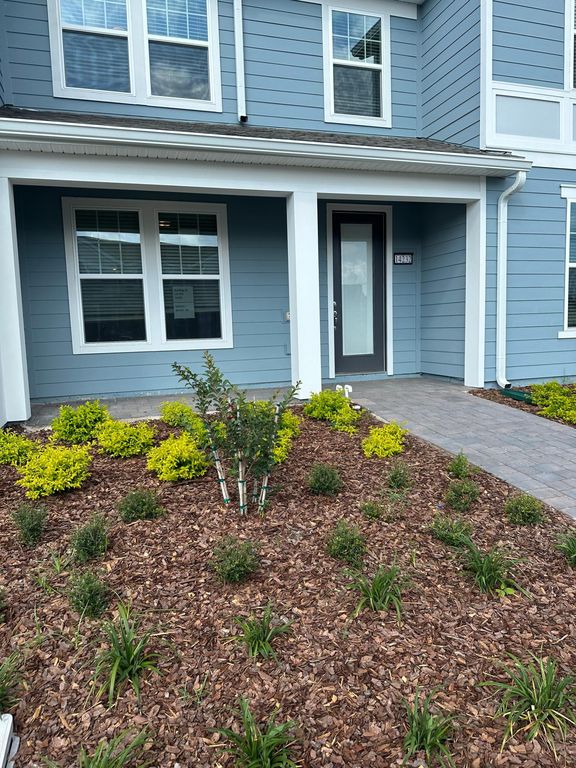
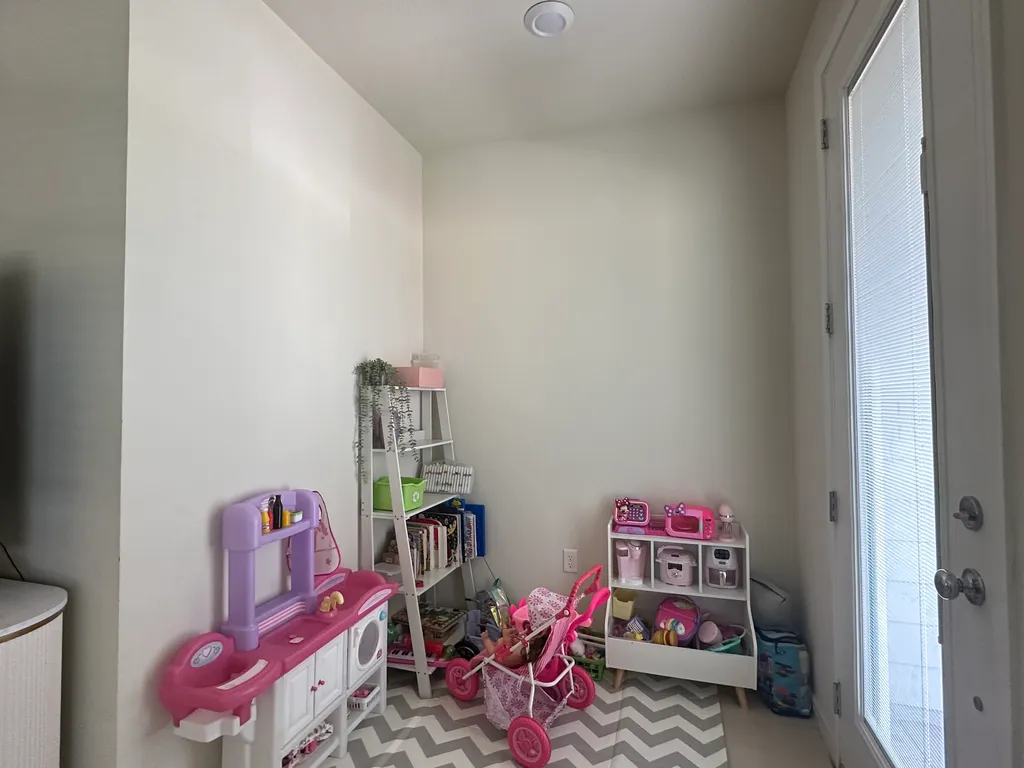
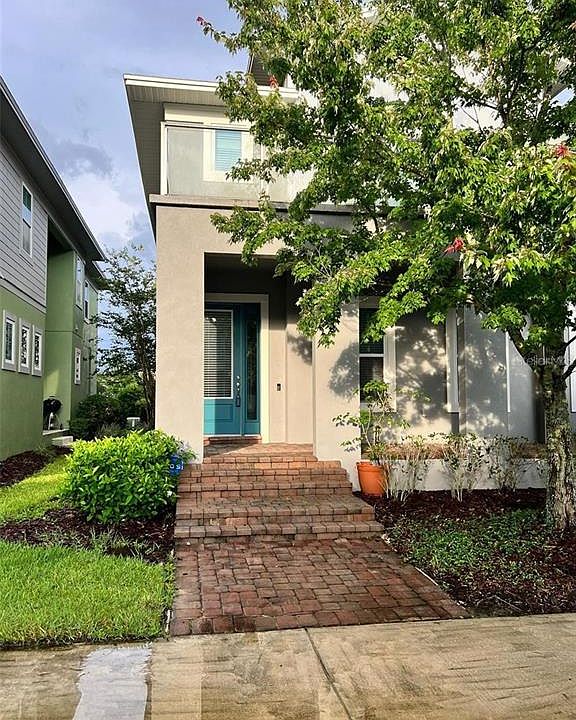
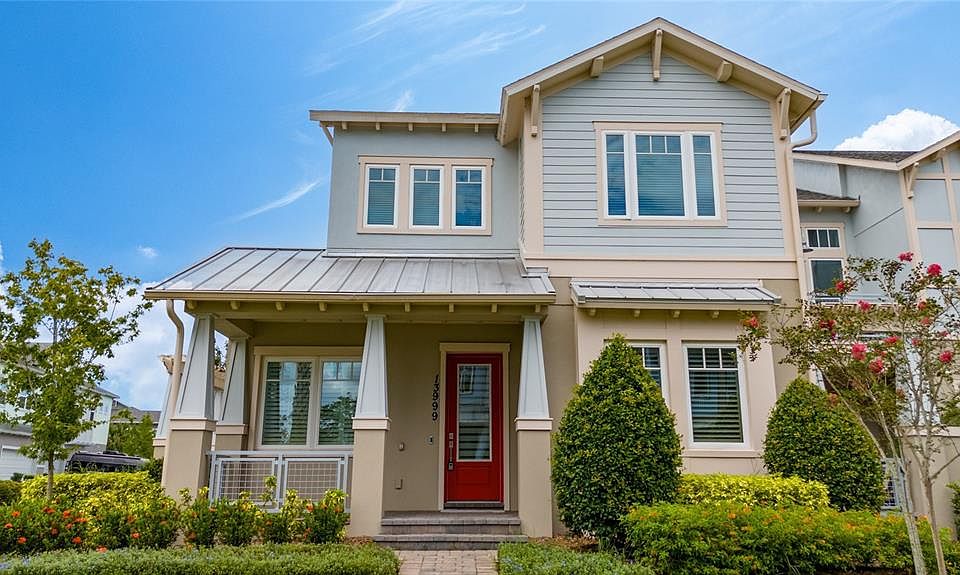
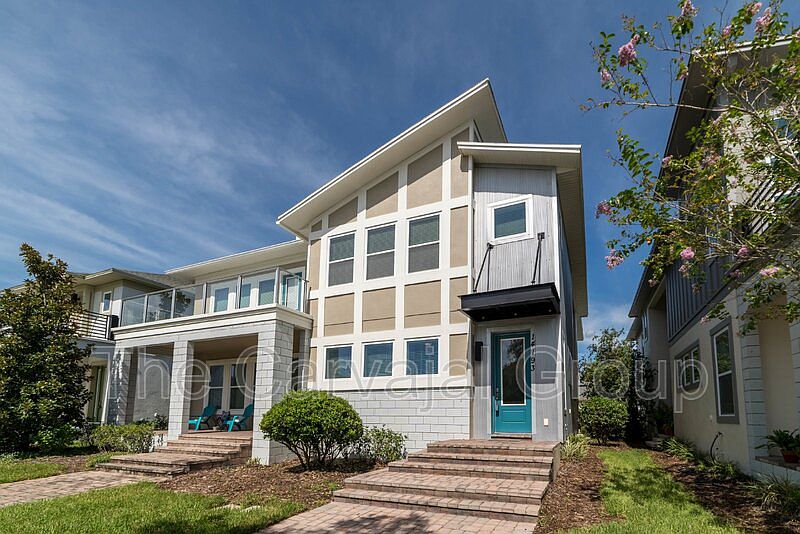
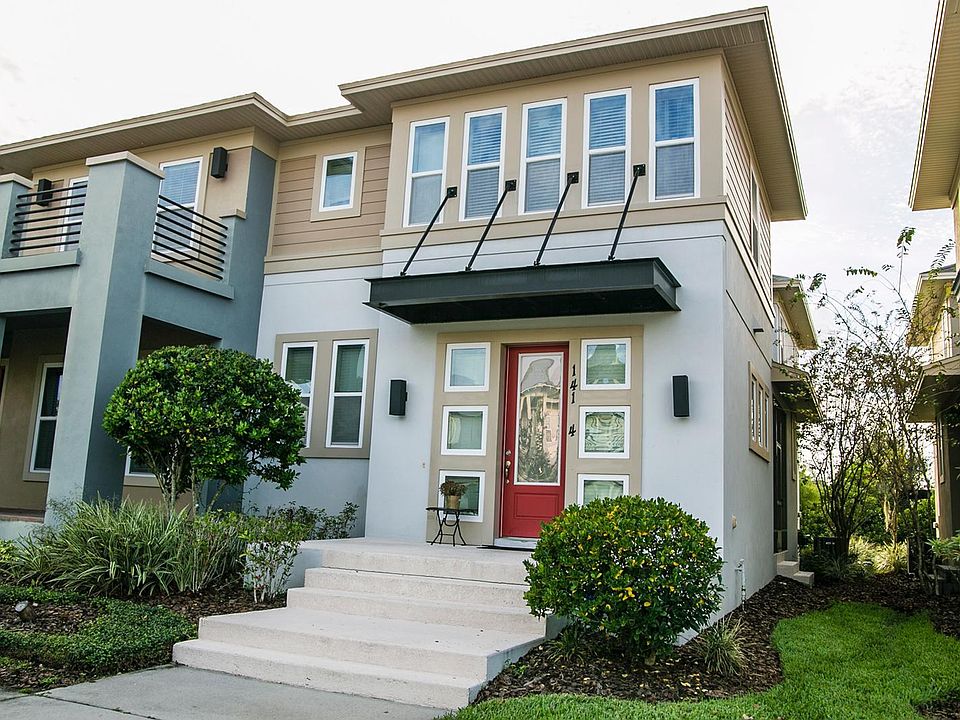
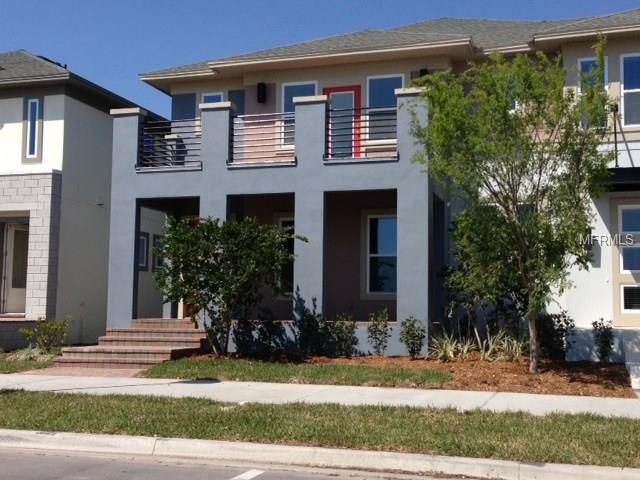
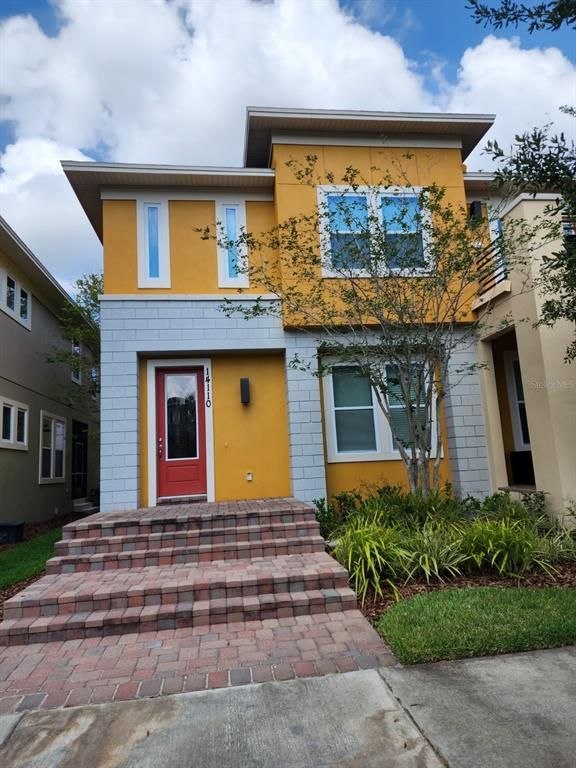
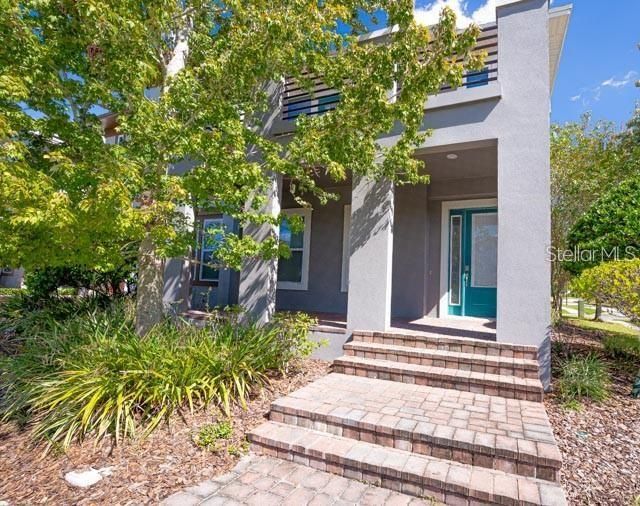
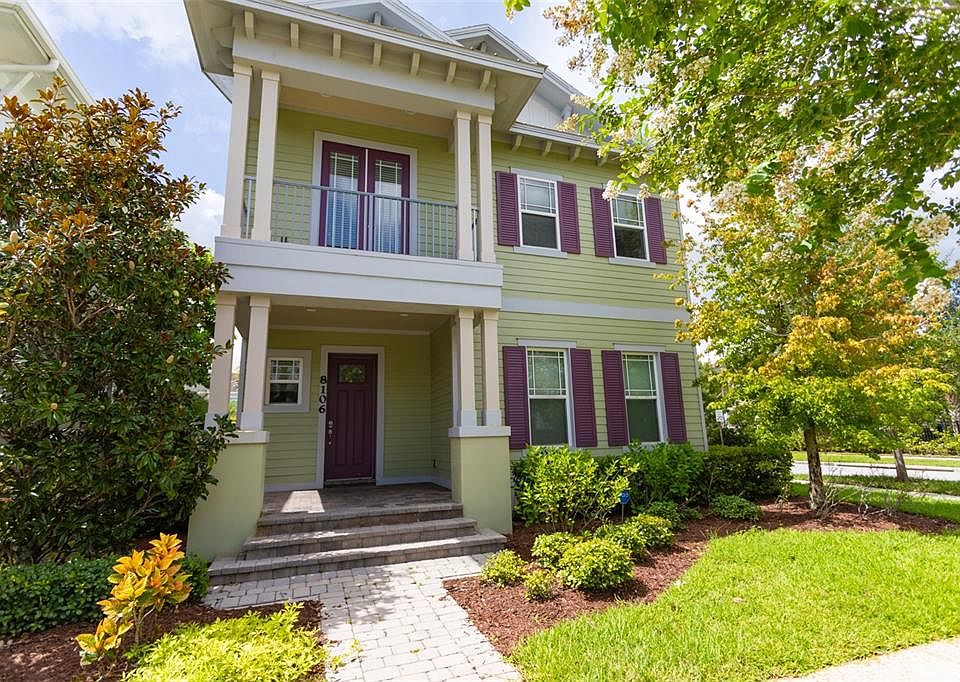
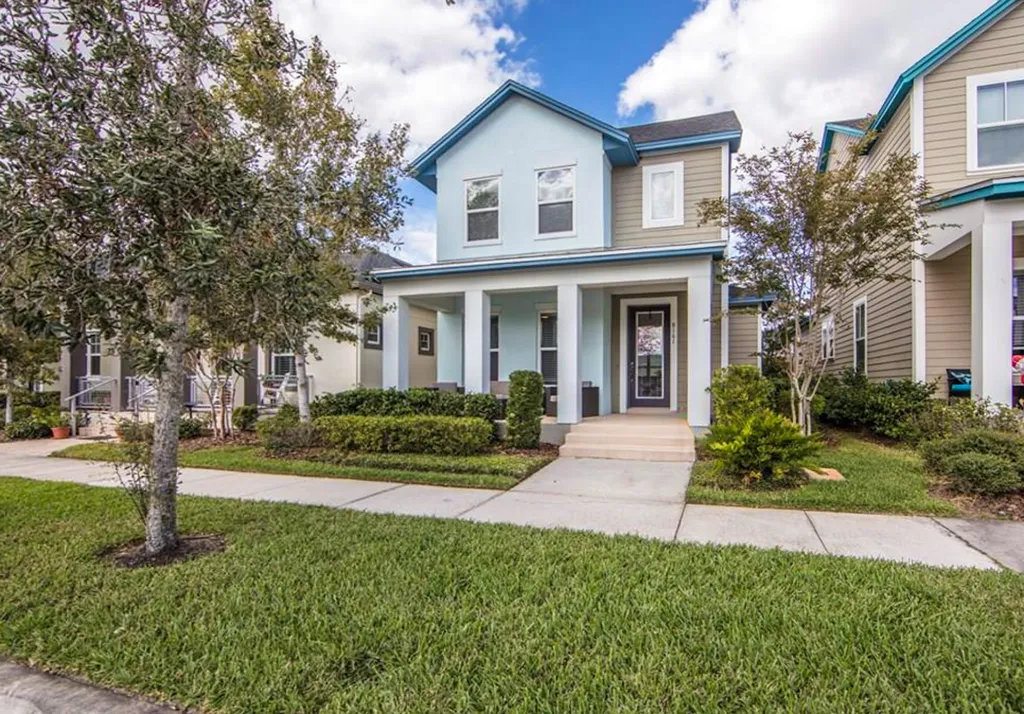
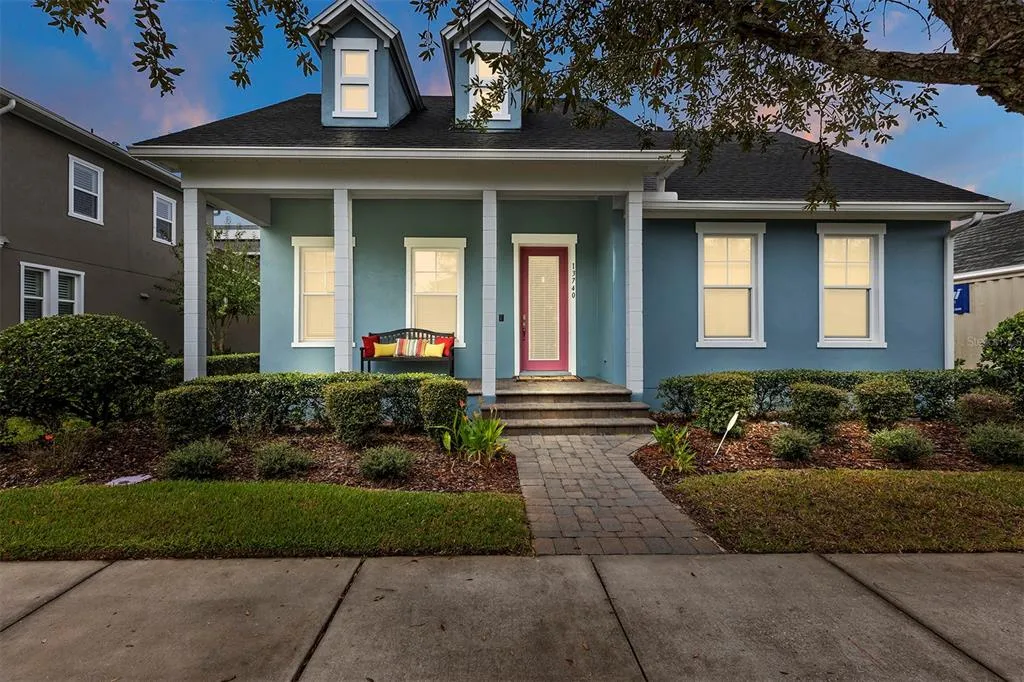
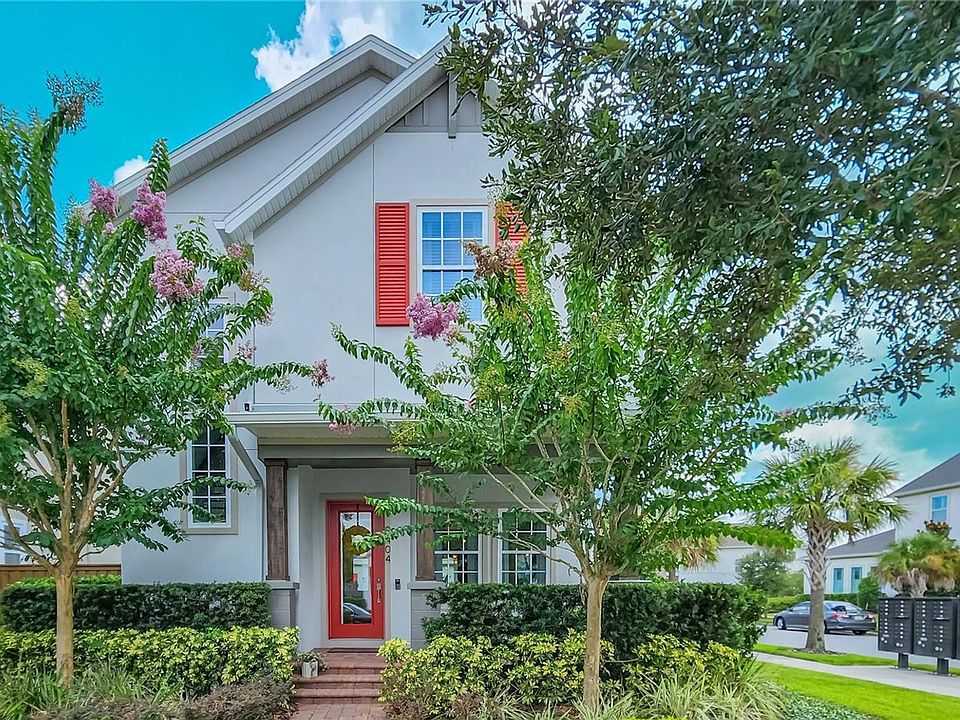
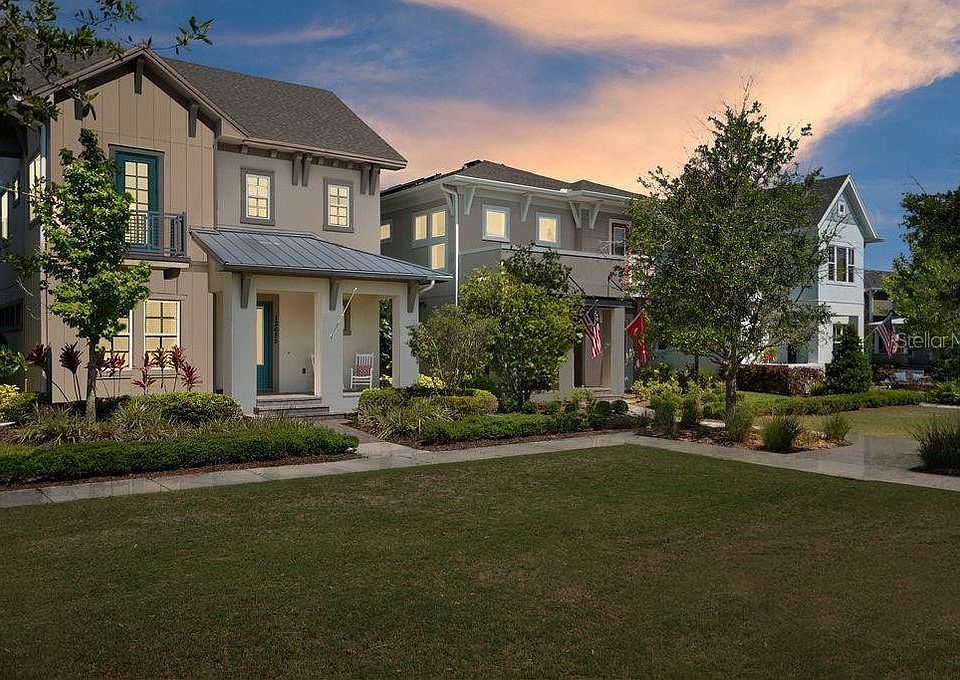
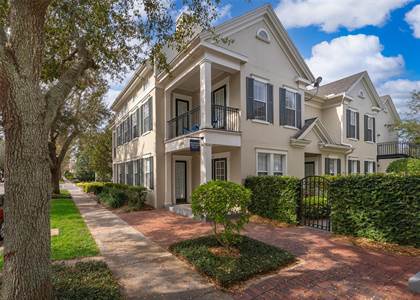
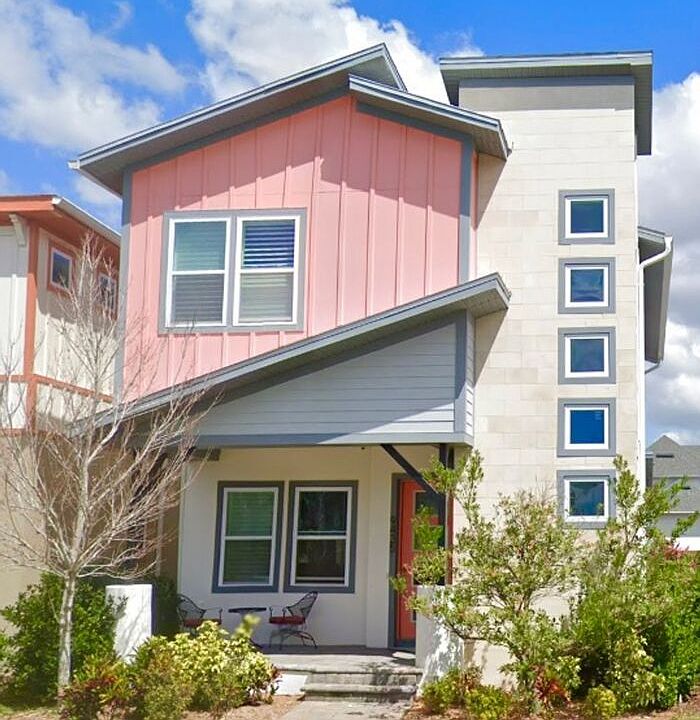
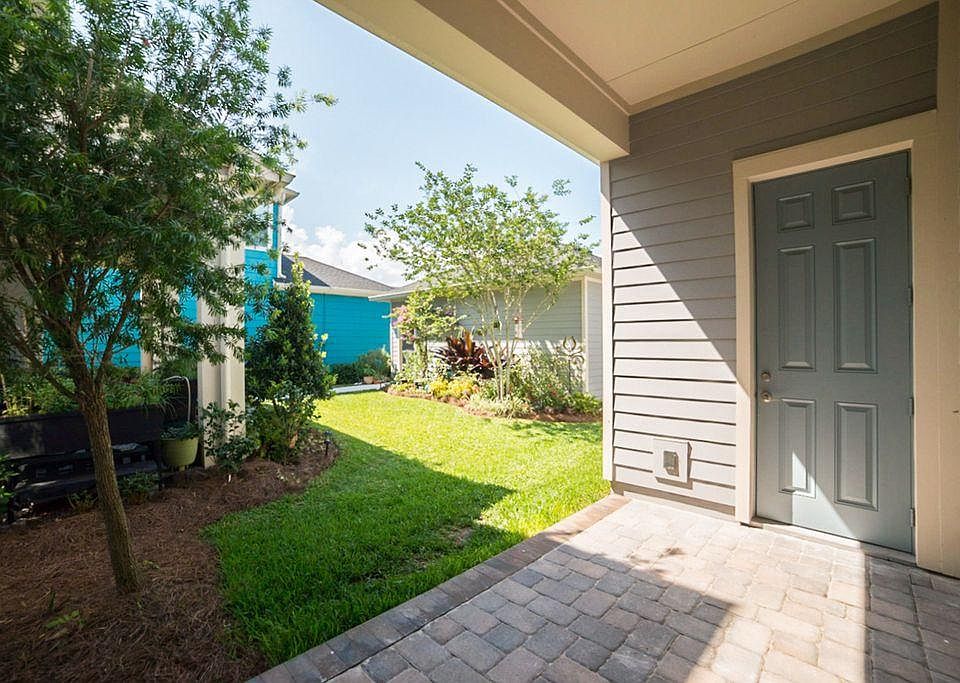
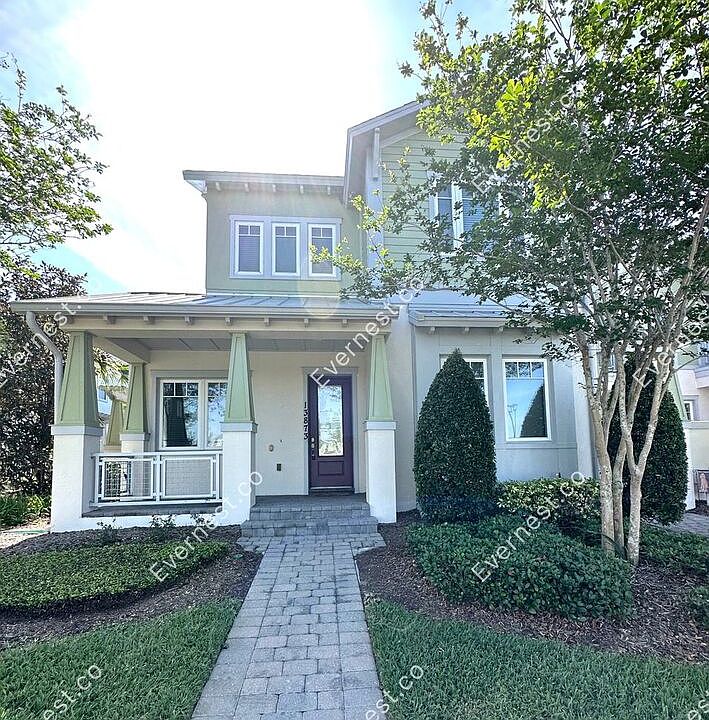
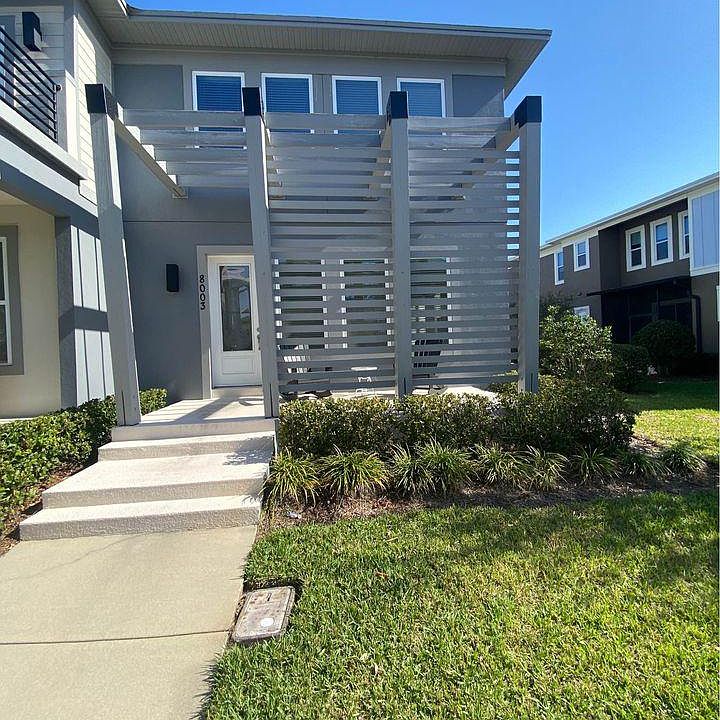
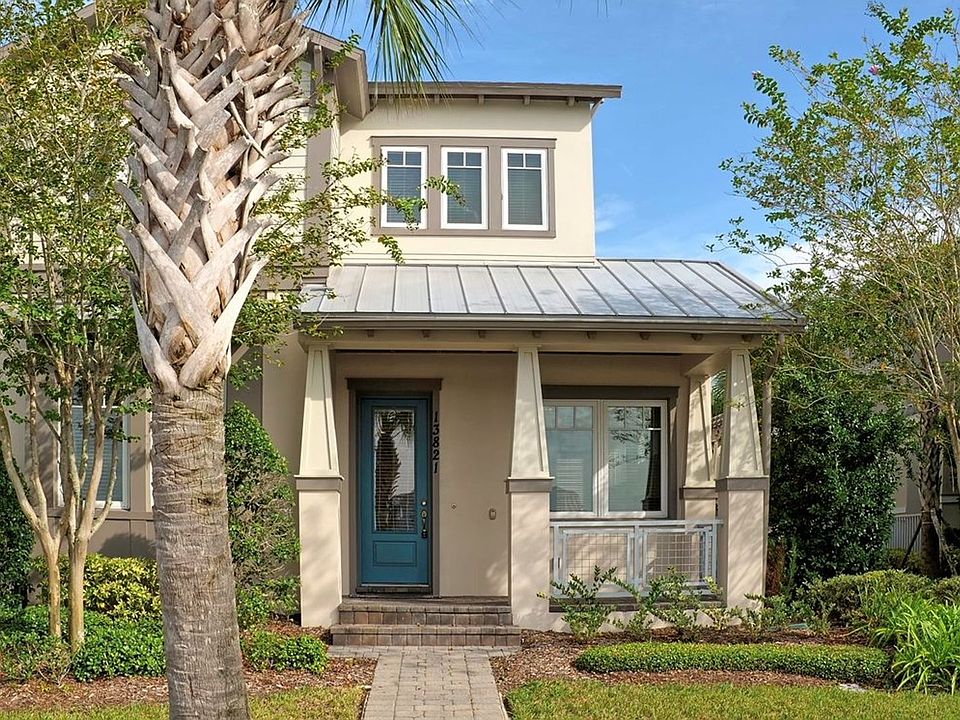
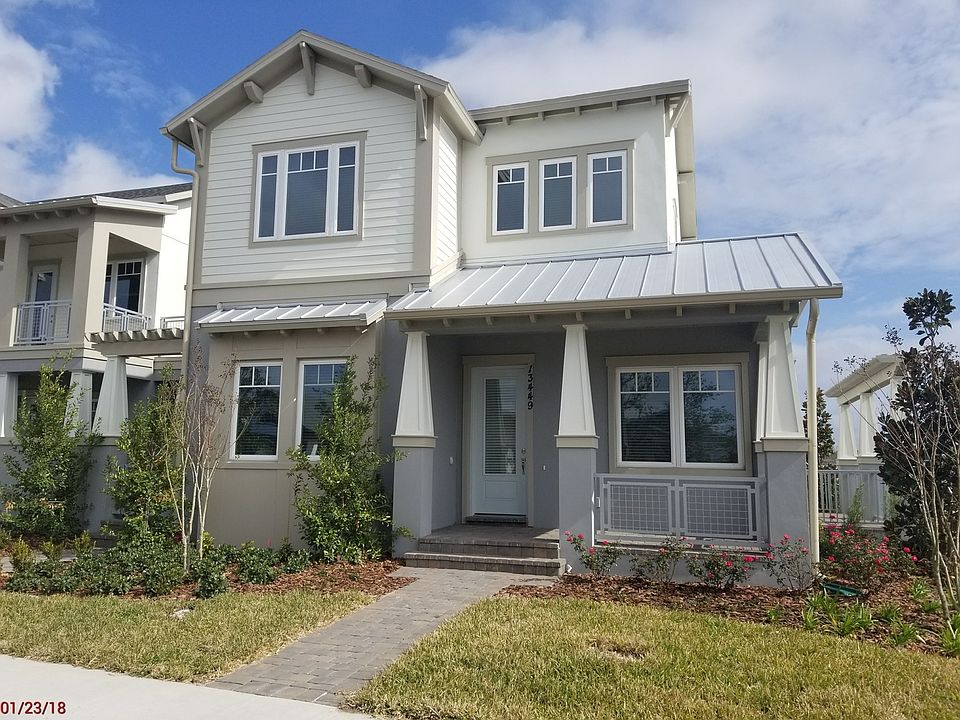
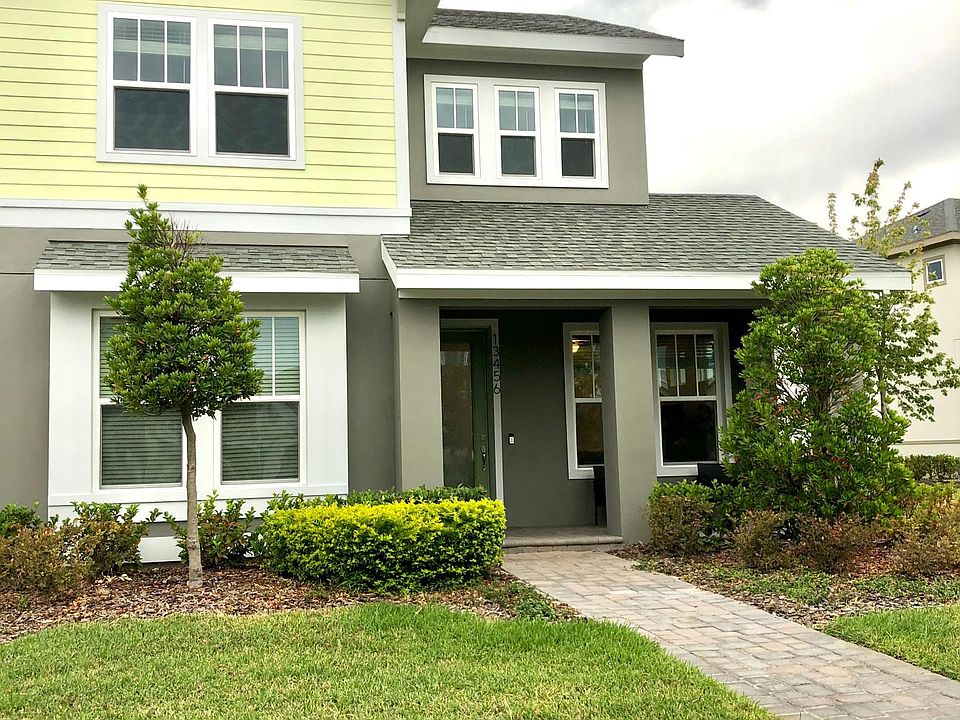
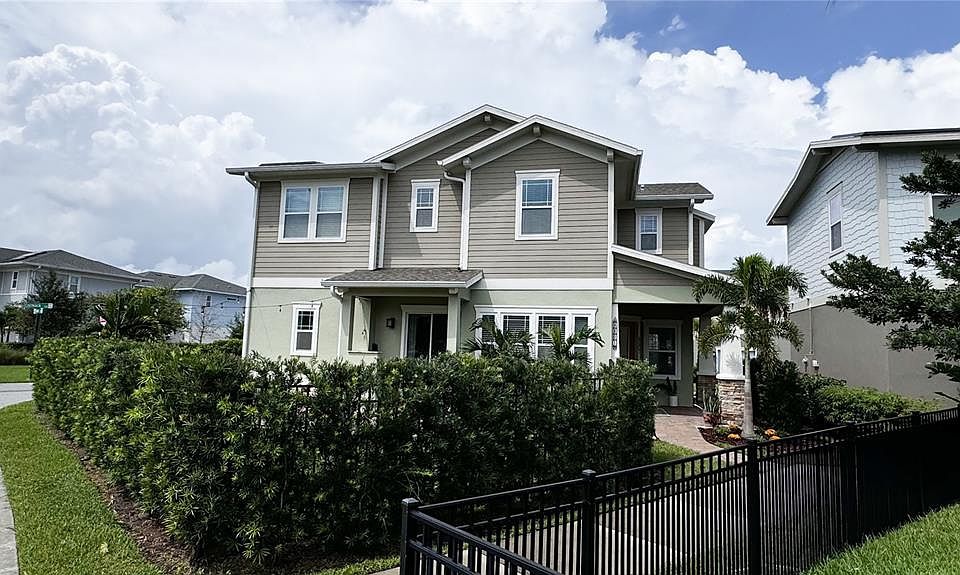
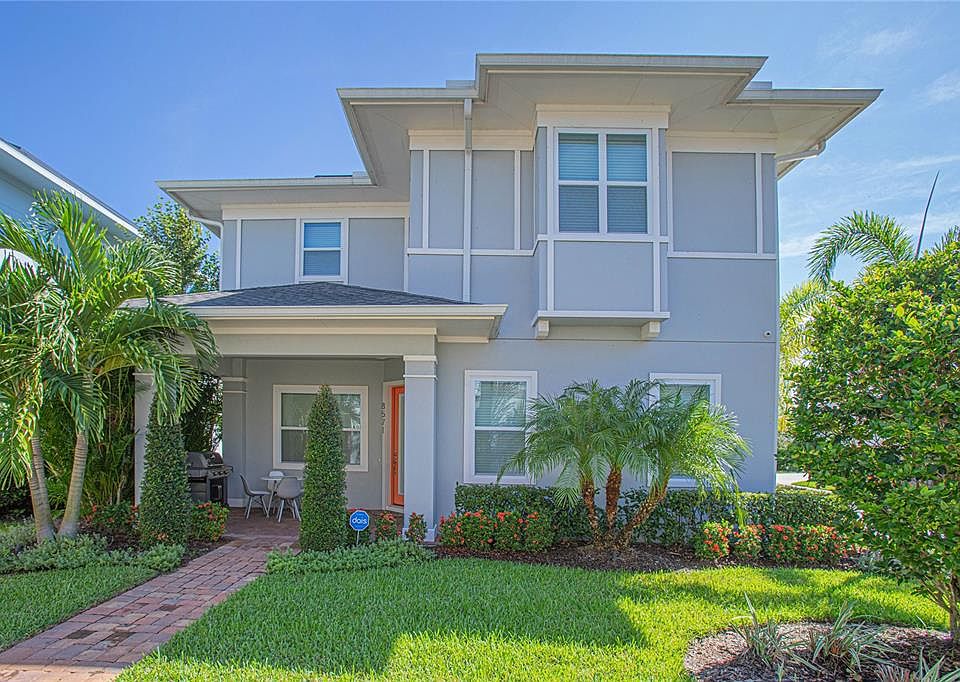
Investment Opportunity: Off-Market Listing: Resideline estimates that this property can be rented long-term for an average of $3,155 per month, based on comparable local listings. Estimated long-term cap rate of -1.6%. One or more photo(s) has been virtually staged. Under Construction. Sample Image The Tailor Model by Craft Homes is on lot 146A is a new Townhome Floor Plan with 3 Bedrooms and 2.5 baths. The master is located on the 1st floor. Come take a tour of you next home. READY SPRING 2024
Monthly Rent | $3,155 |
Monthly HOA | $370 |
Rental Policy | STR Restrictions |
Yearly Taxes | $2022 |
Bedrooms | 3 |
Bathrooms | 3 |
SQFT | 2,059 |
Furnished | N/A |
Year built | 2024 |
Listing Status | Off Market |
MLS | G5069650 |
Interest rate
Let’s analyze a 30-year fixed-rate mortgage for $650,859 at today’s interest rate of 0.07%.
The initial loan size, equal to your condo price: $650,859.
The monthly cost of borrowing, based on an annual rate of 0.07% (divided by 12).
Over 30 years, you’ll make 360 payments (30 years × 12 months).
Estimated monthly Homeowner Association fees: $370.
Yearly taxes of $2022, divided by 12 for a monthly estimate.
Combining principal, interest, payments, HOA fees, and taxes, your approximate yearly mortgage expenses are $48,024.
The capitalization (cap) rate measures a property’s rate of return based on its income. It’s calculated by dividing the Net Operating Income (NOI) by the Current Market Value, expressed as a percentage.
The income after operating expenses (e.g., management, maintenance, insurance), calculated as gross rental income minus these costs: $-10,164.
The estimated property value based on recent sales of similar properties: $650,859.
For a property with an NOI of $-10,164 per year and a market value of $650,859:
Formula: NOI / Current Market Value
$-10,164 / $650,859 = -1.6%
The capitalization (cap) rate measures a property’s rate of return based on its income. For short-term rentals, it’s calculated by dividing the Net Operating Income (NOI) by the Current Market Value, expressed as a percentage.
The income after operating expenses (e.g., management, maintenance, insurance), calculated as gross rental income minus these costs: $-48,024.
The estimated property value based on recent sales of similar properties: $650,859.
For a property with an NOI of $-48,024 per year and a market value of $650,859:
Formula: NOI / Current Market Value
$-48,024 / $650,859 = -7.4%
Interest rate
Cash on Cash Return is a key real estate metric that measures the annual cash income earned relative to the cash invested, expressed as a percentage. It’s calculated by dividing the Annual Pre-Tax Cash Flow by the Total Cash Invested.
The property’s yearly income after operating expenses, excluding financing costs.
Includes your down payment plus additional costs like closing fees.
For a property priced at $650,859 with a 20% down payment and 3% closing costs, and an annual pre-tax cash flow of $-10,164:
Formula: Annual Pre-Tax Cash Flow / Total Cash Invested
$-10,164 / ($650,859 × 0.2 + $650,859 × 0.03) = -6.8%
Cash on Cash Return measures the annual cash income earned from a property relative to the cash invested, expressed as a percentage. For short-term rentals, it’s calculated by dividing the Annual Pre-Tax Cash Flow by the Total Cash Invested.
The property’s yearly income after operating expenses, excluding financing costs.
Includes your down payment plus additional costs like closing fees.
For a property priced at $650,859 with a 20% down payment and 3% closing costs, and an annual pre-tax cash flow of $-48,024:
Formula: Annual Pre-Tax Cash Flow / Total Cash Invested
$-48,024 / ($650,859 × 0.2 + $650,859 × 0.03) = -32.1%
Here’s how we calculate your potential yearly revenue for short-term rentals:
We start with 365 days, the total number of days in a year.
The percentage of the year your property is rented out: Hidden%.
Calculated as 365 days × occupancy rate (Hidden%).
The amount charged per day: Hidden.
Rented days × daily rental rate.
Typically 3% of rental income, plus additional fees like HOA or property-specific costs.
Gross rental income minus fees: $0.
Using the rented days, daily rental rate, and applicable fees, your potential yearly revenue is approximately:
$0
Note: Some properties may have additional short-term rental fees (e.g., 15% at Club at Brickell, Edgewater, Miami), which are included in this calculation.
Monthly Rent Revenue
Yearly Rent Revenue
*Estimate based on similar properties in the area.
41 Comparable listings
$3,500/mo
Dist: 0.11 mi
3
3
2367 sqft
$3,400/mo
Dist: 0.6 mi
3
3
1712 sqft
$2,700/mo
Dist: 0.63 mi
3
3
1652 sqft
$2,800/mo
Dist: 0.65 mi
3
3
1652 sqft
$2,600/mo
Dist: 0.65 mi
3
3
1652 sqft
$2,900/mo
Dist: 0.65 mi
3
3
1652 sqft
$2,800/mo
Dist: 0.65 mi
3
3
1652 sqft
$2,900/mo
Dist: 0.7 mi
3
3
1861 sqft
$2,650/mo
Dist: 0.7 mi
3
3
1652 sqft
$2,995/mo
Dist: 0.97 mi
3
3
1950 sqft
$3,250/mo
Dist: 0.98 mi
3
3
1945 sqft
$2,900/mo
Dist: 0.98 mi
3
3
1908 sqft
$2,900/mo
Dist: 0.98 mi
3
3
1908 sqft
$2,975/mo
Dist: 0.99 mi
3
3
1945 sqft
$2,900/mo
Dist: 0.99 mi
3
3
1945 sqft
$2,880/mo
Dist: 1.02 mi
3
3
1647 sqft
$2,950/mo
Dist: 1.02 mi
3
3
1936 sqft
$3,050/mo
Dist: 1.03 mi
3
3
1976 sqft
$2,900/mo
Dist: 1.04 mi
3
3
1935 sqft
$3,250/mo
Dist: 1.14 mi
3
3
2032 sqft
$3,400/mo
Dist: 1.14 mi
3
3
1832 sqft
$3,600/mo
Dist: 1.15 mi
3
3
1697 sqft
$3,700/mo
Dist: 1.15 mi
3
3
2268 sqft
$3,345/mo
Dist: 1.17 mi
3
3
1947 sqft
$4,700/mo
Dist: 1.18 mi
3
3
2258 sqft
$3,200/mo
Dist: 1.22 mi
3
3
2311 sqft
$3,650/mo
Dist: 1.24 mi
3
3
1794 sqft
$3,400/mo
Dist: 1.24 mi
3
3
2250 sqft
$3,800/mo
Dist: 1.25 mi
3
3
2150 sqft
$3,420/mo
Dist: 1.25 mi
3
3
1787 sqft
$3,150/mo
Dist: 1.29 mi
3
3
1936 sqft
$3,100/mo
Dist: 1.34 mi
3
3
1944 sqft
$3,150/mo
Dist: 1.34 mi
3
3
2091 sqft
$3,150/mo
Dist: 1.35 mi
3
3
1944 sqft
$2,840/mo
Dist: 1.35 mi
3
3
1944 sqft
$2,800/mo
Dist: 1.35 mi
3
3
1944 sqft
$2,700/mo
Dist: 1.35 mi
3
3
1776 sqft
$2,995/mo
Dist: 1.46 mi
3
3
1945 sqft
$3,100/mo
Dist: 1.47 mi
3
3
1978 sqft
$3,600/mo
Dist: 1.47 mi
3
3
1947 sqft
$3,350/mo
Dist: 1.48 mi
3
3
1994 sqft