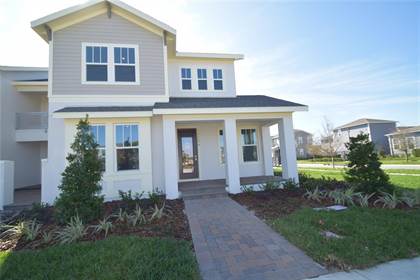
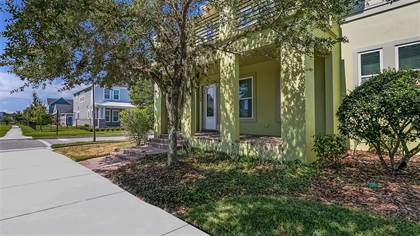
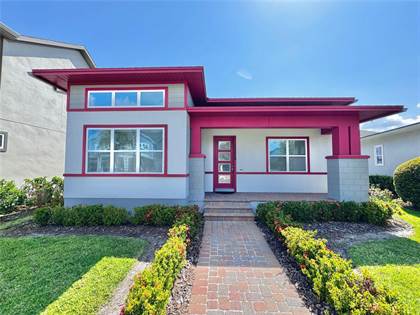
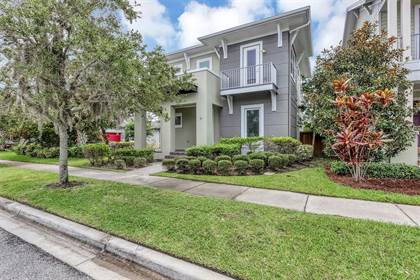
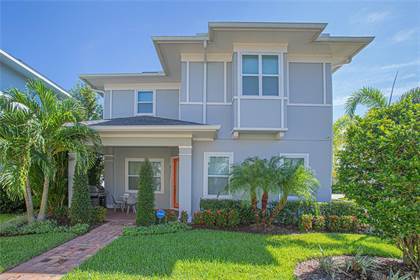
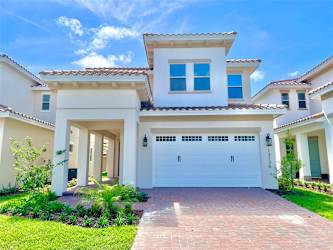
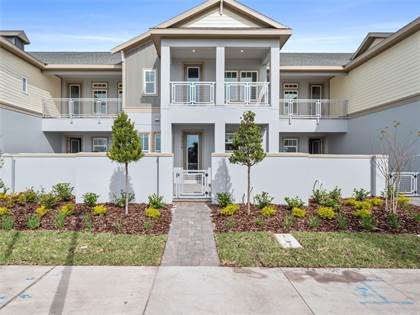
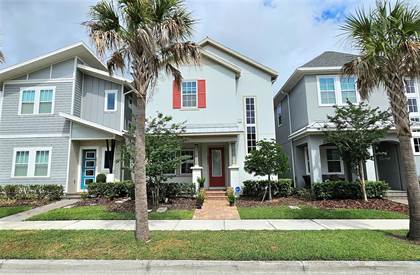
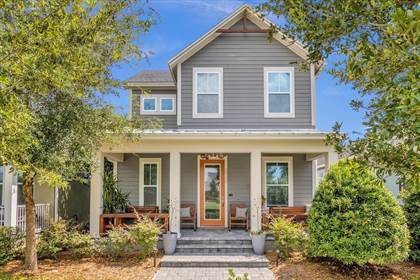
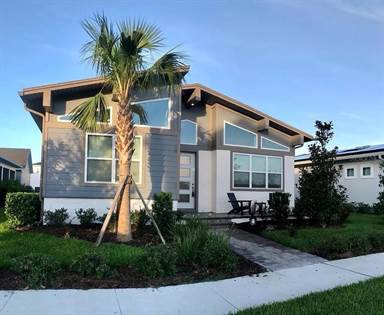
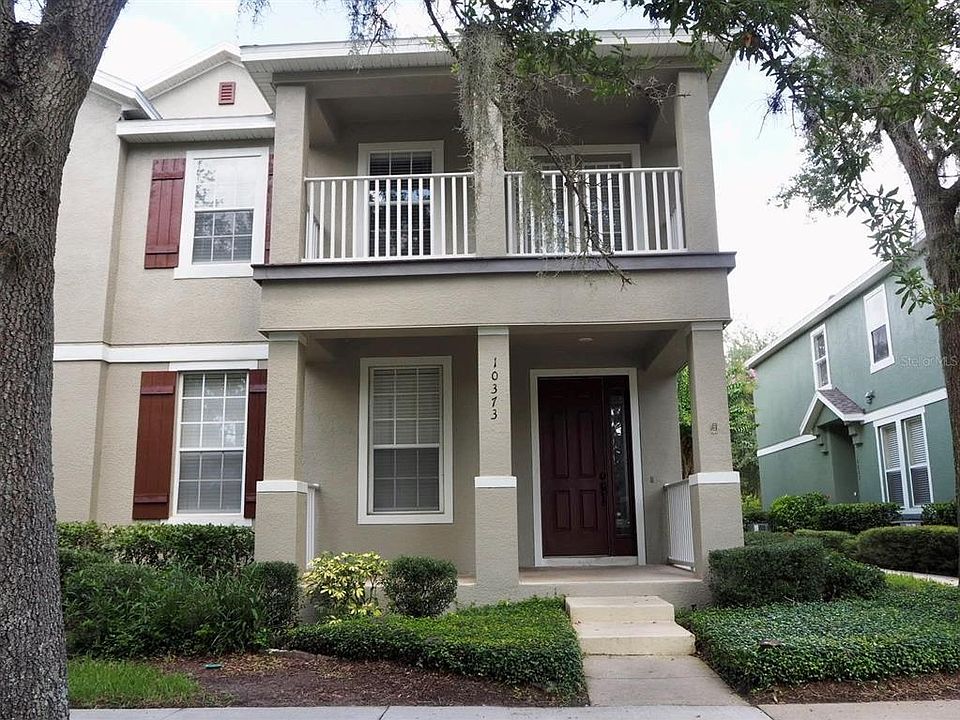
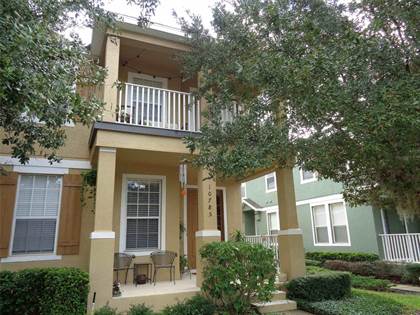
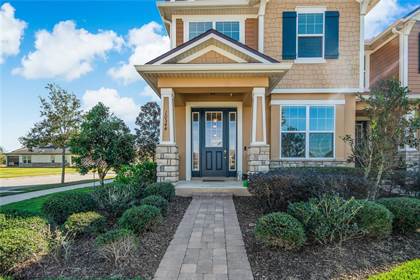
Investment Opportunity: Off-Market Listing: Resideline estimates that this property can be rented long-term for an average of $3,300 per month, based on comparable local listings. Estimated long-term cap rate of -1.8%. One or more photo(s) has been virtually staged. Under Construction. Sample Images*** Potter townhome end unit on lot 119a Ready Dec/Jan 2023/2024 Luxury 3 Bedroom and 2.5 bath with the master on the first floor. Over 2000sqft home offers an open floor plan. Very modern and top of the line finishes in the kitchen and living areas with a wide stair case. Oversize 2 car garage with long driveway.
Monthly Rent | $3,300 |
Monthly HOA | $370 |
Rental Policy | STR Restrictions |
Yearly Taxes | $5700 |
Bedrooms | 3 |
Bathrooms | 3 |
SQFT | 2,079 |
Furnished | unknown |
Year built | 2024 |
Listing Status | Off Market |
MLS | G5068237 |
Interest rate
Let’s analyze a 30-year fixed-rate mortgage for $639,361 at today’s interest rate of 0.07%.
The initial loan size, equal to your condo price: $639,361.
The monthly cost of borrowing, based on an annual rate of 0.07% (divided by 12).
Over 30 years, you’ll make 360 payments (30 years × 12 months).
Estimated monthly Homeowner Association fees: $370.
Yearly taxes of $5700, divided by 12 for a monthly estimate.
Combining principal, interest, payments, HOA fees, and taxes, your approximate yearly mortgage expenses are $50,964.
The capitalization (cap) rate measures a property’s rate of return based on its income. It’s calculated by dividing the Net Operating Income (NOI) by the Current Market Value, expressed as a percentage.
The income after operating expenses (e.g., management, maintenance, insurance), calculated as gross rental income minus these costs: $-11,364.
The estimated property value based on recent sales of similar properties: $639,361.
For a property with an NOI of $-11,364 per year and a market value of $639,361:
Formula: NOI / Current Market Value
$-11,364 / $639,361 = -1.8%
The capitalization (cap) rate measures a property’s rate of return based on its income. For short-term rentals, it’s calculated by dividing the Net Operating Income (NOI) by the Current Market Value, expressed as a percentage.
The income after operating expenses (e.g., management, maintenance, insurance), calculated as gross rental income minus these costs: $-50,964.
The estimated property value based on recent sales of similar properties: $639,361.
For a property with an NOI of $-50,964 per year and a market value of $639,361:
Formula: NOI / Current Market Value
$-50,964 / $639,361 = -8.0%
Interest rate
Cash on Cash Return is a key real estate metric that measures the annual cash income earned relative to the cash invested, expressed as a percentage. It’s calculated by dividing the Annual Pre-Tax Cash Flow by the Total Cash Invested.
The property’s yearly income after operating expenses, excluding financing costs.
Includes your down payment plus additional costs like closing fees.
For a property priced at $639,361 with a 20% down payment and 3% closing costs, and an annual pre-tax cash flow of $-11,364:
Formula: Annual Pre-Tax Cash Flow / Total Cash Invested
$-11,364 / ($639,361 × 0.2 + $639,361 × 0.03) = -7.7%
Cash on Cash Return measures the annual cash income earned from a property relative to the cash invested, expressed as a percentage. For short-term rentals, it’s calculated by dividing the Annual Pre-Tax Cash Flow by the Total Cash Invested.
The property’s yearly income after operating expenses, excluding financing costs.
Includes your down payment plus additional costs like closing fees.
For a property priced at $639,361 with a 20% down payment and 3% closing costs, and an annual pre-tax cash flow of $-50,964:
Formula: Annual Pre-Tax Cash Flow / Total Cash Invested
$-50,964 / ($639,361 × 0.2 + $639,361 × 0.03) = -34.7%
Here’s how we calculate your potential yearly revenue for short-term rentals:
We start with 365 days, the total number of days in a year.
The percentage of the year your property is rented out: Hidden%.
Calculated as 365 days × occupancy rate (Hidden%).
The amount charged per day: Hidden.
Rented days × daily rental rate.
Typically 3% of rental income, plus additional fees like HOA or property-specific costs.
Gross rental income minus fees: $0.
Using the rented days, daily rental rate, and applicable fees, your potential yearly revenue is approximately:
$0
Note: Some properties may have additional short-term rental fees (e.g., 15% at Club at Brickell, Edgewater, Miami), which are included in this calculation.
Monthly Rent Revenue
Yearly Rent Revenue
*Estimate based on similar properties in the area.
63 Properties Comparable listings
$3,000/mo
Dist: 0.09 mi
3
3
1978 sqft
$3,350/mo
Dist: 0.79 mi
3
3
2138 sqft
$3,095/mo
Dist: 0.93 mi
3
3
1950 sqft
$3,199/mo
Dist: 0.93 mi
3
3
1916 sqft
$3,100/mo
Dist: 0.97 mi
3
3
1811 sqft
$3,100/mo
Dist: 0.98 mi
3
3
1998 sqft
$3,775/mo
Dist: 1.0 mi
3
3
2310 sqft
$3,550/mo
Dist: 1.0 mi
3
3
2310 sqft
$3,150/mo
Dist: 1.03 mi
3
3
1948 sqft
$2,790/mo
Dist: 1.1 mi
3
3
1801 sqft
$3,300/mo
Dist: 1.1 mi
3
3
2258 sqft
$3,450/mo
Dist: 1.45 mi
3
3
1994 sqft
$3,425/mo
Dist: 1.46 mi
3
3
2119 sqft
$2,960/mo
Dist: 1.48 mi
3
3
1927 sqft
$4,000/mo
Dist: 1.49 mi
3
3
2261 sqft
$3,450/mo
Dist: 1.51 mi
3
3
2261 sqft
$2,950/mo
Dist: 1.65 mi
3
3
1780 sqft
$4,000/mo
Dist: 1.67 mi
3
3
2175 sqft
$3,000/mo
Dist: 1.67 mi
3
3
1978 sqft
$3,850/mo
Dist: 1.67 mi
3
3
2261 sqft
$3,900/mo
Dist: 1.67 mi
3
3
2261 sqft
$3,098/mo
Dist: 1.75 mi
3
3
2238 sqft
$3,800/mo
Dist: 1.75 mi
3
3
1787 sqft
$3,850/mo
Dist: 1.78 mi
3
3
1957 sqft
$3,200/mo
Dist: 1.81 mi
3
3
2056 sqft
$3,200/mo
Dist: 1.83 mi
3
3
2175 sqft
$3,500/mo
Dist: 1.88 mi
3
3
2261 sqft
$3,800/mo
Dist: 2.91 mi
3
3
2176 sqft
$3,650/mo
Dist: 2.91 mi
3
3
2176 sqft
$2,500/mo
Dist: 4.7 mi
3
3
1771 sqft
$2,295/mo
Dist: 4.86 mi
3
3
1771 sqft
$2,300/mo
Dist: 5.13 mi
3
3
1784 sqft
$2,850/mo
Dist: 6.23 mi
3
3
1878 sqft
$3,500/mo
Dist: 6.92 mi
3
3
2261 sqft
$3,350/mo
Dist: 15.08 mi
3
3
2175 sqft
$3,500/mo
Dist: 15.08 mi
3
3
2261 sqft