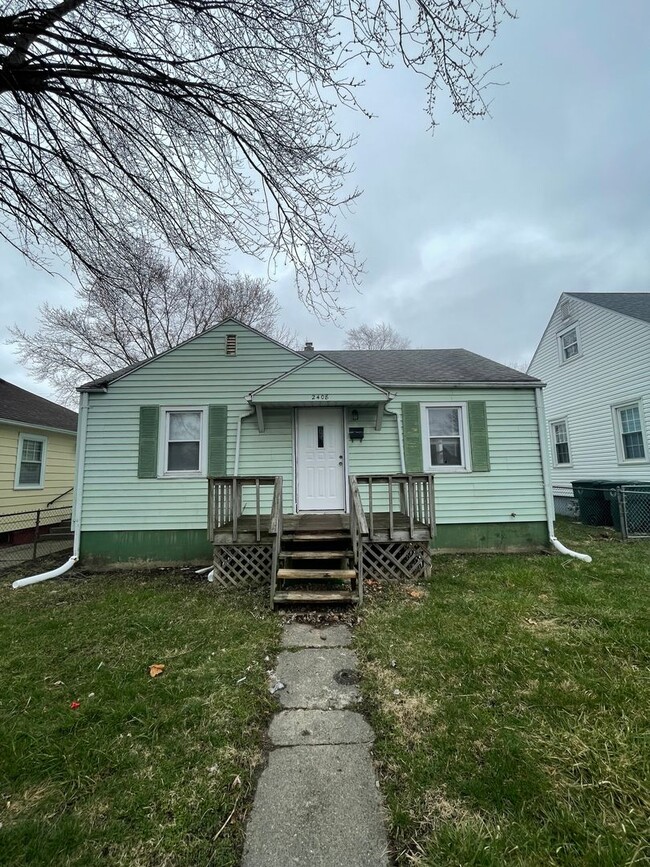
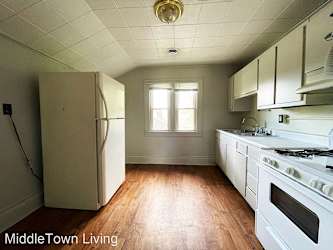
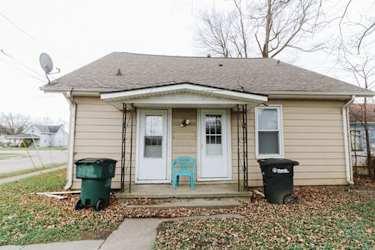
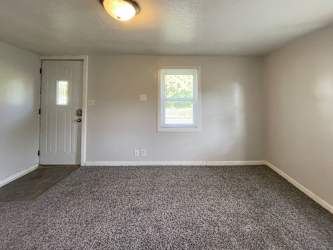
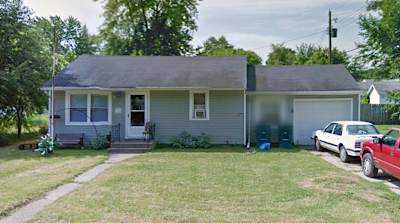
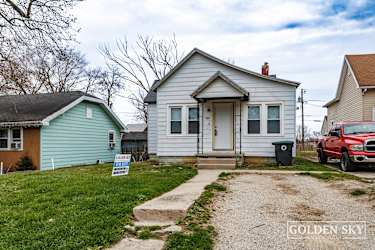
Part of a possible 10 package deal all in Muncie. This property features 2 beds/1 bath. It's currently rented for $715 a month, on a year lease. Lease ends 12-31-24. Tenants pay all utilities. It also has a completely fenced yard. Possible Muncie package deal with: BSU 1016 W Marsh St # 21956790 921 W Neely Ave # 21956792 823-825 W North St # 21956801 1701 W Adams St # 21956805 1714 W Adams St # 21956811 600 S Brittain Ave # 21956824 708 S Brittain Ave # 21956825 327 S Talley Ave # 21956821 Southside 2304 S Pershing Dr # 21956830 2413 S Ebright St # 21956835
airbnb avg Daily | See Full Details |
Occupancy Rate | See Full Details |
Monthly HOA | $0 |
rental Policy | daily |
Yearly Taxes | $1559 |
Bedrooms | 2 |
Bathrooms | 1 |
SQFT | 720 |
Furnished | unknown |
Year built | 1947 |
MLS | 21956835 |
Let's consider the scenario of taking a 30-year fixed-rate mortgage for at today's interest rate of 0.07%.
Here's the breakdown of your mortgage expenses:
Principal loan amount:This is the initial size of your loan, or in other words, your condo price. For this scenario, it's .
Interest rate:This is the cost of borrowing money, calculated monthly. Your annual interest rate is 0.07%, so we divide that by 12 for each month.
Total number of payments: Over the course of 30 years, you'll make 360 payments (that's 30 years multiplied by 12 months).
HOA fees: Homeowner Association fees are estimated to be $0 each month.
Property Taxes:Your yearly property taxes are $1559. We divide this by 12 to estimate the monthly cost.
Given these factors, your yearly mortgage expenses would be calculated using a formula that includes your principal loan amount, interest rate, total number of payments, HOA fees, and property taxes. This comes out to be approximately $5,700, rounded to the nearest cent.
The capitalization (cap) rate measures a property's rate of return based on its income. It's calculated as the Net Operating Income (NOI) divided by the property's Current Market Value.
Cap Rate Formula: NOI / Current Market Value
Net Operating Income (NOI): The income after subtracting operating expenses like management, maintenance, and insurance. Typically, it's the gross rental income minus these expenses which is $4,224.
Current Market Value: The estimated property value based on recent sales of similar properties which is $64,900.
Calculation: For a property with an NOI of $19,128 per year and a market value of , the cap rate would be: $4,224 / $64,900 = 6.5%
The capitalization (cap) rate measures a property's rate of return based on its income. It's calculated as the Net Operating Income (NOI) divided by the property's Current Market Value.
Cap Rate Formula: NOI / Current Market Value
Net Operating Income (NOI): The income after subtracting operating expenses like management, maintenance, and insurance. Typically, it's the gross rental income minus these expenses which is $19,128.
Current Market Value: The estimated property value based on recent sales of similar properties which is $64,900.
Calculation: For a property with an NOI of $19,128 per year and a market value of , the cap rate would be: $19,128 / $64,900 = 29.5%
Interest rate
Interest rate
Cash on Cash Return is a rate of return metric used in real estate investments that calculates the cash income earned on the cash invested in a property. It is expressed as a percentage and is calculated by dividing the annual pre-tax cash flow by the total cash invested.
Cash on Cash Formula: Annual Pre-Tax Cash Flow / Total Cash Invested
Annual Pre-Tax Cash Flow is the income the property generates in a year after operating expenses, excluding financing costs.
Total Cash Invested includes the down payment and any additional costs like closing costs.
For example, with a down payment of 20% and closing costs of 3% on a property priced at $64,900, and annual pre-tax cash flow of $4,224
The Cash on Cash Return would be:
$4,224 / ($64,900 * 0.2 + $64,900 * 0.03) = 28.3%
Cash on Cash Return is a rate of return metric used in real estate investments that calculates the cash income earned on the cash invested in a property. It is expressed as a percentage and is calculated by dividing the annual pre-tax cash flow by the total cash invested.
Cash on Cash Formula: Annual Pre-Tax Cash Flow / Total Cash Invested
Annual Pre-Tax Cash Flow is the income the property generates in a year after operating expenses, excluding financing costs.
Total Cash Invested includes the down payment and any additional costs like closing costs.
For example, with a down payment of 20% and closing costs of 3% on a property priced at $64,900, and annual pre-tax cash flow of $19,128,
The Cash on Cash Return would be:
$19,128 / ($64,900 * 0.2 + $64,900 * 0.03) = 133.3%
Here's how we calculate your potential yearly revenue:
Total days in a year: We start with 365 days, the total number of days in one year.
Occupancy rate: This is the percentage of the year your property is rented out. For this scenario, it's Hidden%.
Rented days per year: We calculate this by multiplying the total days in a year (365) by your occupancy rate.
Daily rental rate: This is the amount you charge for one day of renting out your property. In this case, it's Hidden.
Gross rental income: We calculate this by multiplying the number of rented days by the daily rental rate.
Airbnb and other fees: These are the costs of using a service like Airbnb to rent out your property, which typically take about 3% from your rental income. Additional fees may include homeowner association fees or other applicable costs.
Net rental income (your yearly revenue): We calculate this by subtracting the Airbnb and other fees from your gross rental income. In this case, this amount is $24,828.
Please note that some properties may have additional short-term rental fees. For example, the Club at Brickell in Edgewater, Miami, charges an additional 15% for short-term rentals. These additional fees are already included in the revenue calculation.
So, given these factors, your potential yearly revenue is calculated using the number of rented days, the daily rental rate, and any applicable fees. This comes out to be approximately $24,828.
Monthly Rent Revenue
Yearly Rent Revenue
*Estimate based on similar properties in the area.
120 Comparable listings
$900/mo
Dist: 0.08 mi
2
1
819 sqft
$900/mo
Dist: 0.08 mi
2
1
819 sqft
$850/mo
Dist: 0.12 mi
2
1
720 sqft
$850/mo
Dist: 0.12 mi
2
1
720 sqft
$895/mo
Dist: 0.12 mi
2
1
764 sqft
$750/mo
Dist: 0.12 mi
2
1
764 sqft
$750/mo
Dist: 0.13 mi
2
1
672 sqft
$775/mo
Dist: 0.21 mi
2
1
720 sqft
$775/mo
Dist: 0.21 mi
2
1
720 sqft
$795/mo
Dist: 0.35 mi
2
1
676 sqft
$795/mo
Dist: 0.46 mi
2
1
672 sqft
$775/mo
Dist: 0.49 mi
2
1
672 sqft
$775/mo
Dist: 0.49 mi
2
1
672 sqft
$825/mo
Dist: 0.49 mi
2
1
768 sqft
$825/mo
Dist: 0.49 mi
2
1
768 sqft
$675/mo
Dist: 0.5 mi
2
1
756 sqft
$695/mo
Dist: 0.5 mi
2
1
756 sqft
$825/mo
Dist: 0.5 mi
2
1
826 sqft
$899/mo
Dist: 0.5 mi
2
1
826 sqft
$849/mo
Dist: 0.51 mi
2
1
680 sqft
$900/mo
Dist: 0.59 mi
2
1
780 sqft
$800/mo
Dist: 0.6 mi
2
1
672 sqft
$800/mo
Dist: 0.63 mi
2
1
808 sqft
$895/mo
Dist: 0.66 mi
2
1
768 sqft
$895/mo
Dist: 0.66 mi
2
1
768 sqft
$925/mo
Dist: 0.67 mi
2
1
704 sqft
$900/mo
Dist: 0.73 mi
2
1
780 sqft
$900/mo
Dist: 0.76 mi
2
1
700 sqft
$995/mo
Dist: 0.76 mi
2
1
768 sqft
$995/mo
Dist: 0.76 mi
2
1
768 sqft
$800/mo
Dist: 0.8 mi
2
1
768 sqft
$925/mo
Dist: 0.82 mi
2
1
783 sqft
$925/mo
Dist: 0.82 mi
2
1
783 sqft
$750/mo
Dist: 0.84 mi
2
1
800 sqft
$695/mo
Dist: 0.84 mi
2
1
800 sqft
$750/mo
Dist: 0.96 mi
2
1
672 sqft
$750/mo
Dist: 0.96 mi
2
1
672 sqft
$750/mo
Dist: 0.96 mi
2
1
672 sqft
$695/mo
Dist: 0.97 mi
2
1
800 sqft
$710/mo
Dist: 1.03 mi
2
1
700 sqft
$975/mo
Dist: 1.05 mi
2
1
704 sqft
$800/mo
Dist: 1.07 mi
2
1
768 sqft
$800/mo
Dist: 1.07 mi
2
1
768 sqft
$850/mo
Dist: 1.08 mi
2
1
800 sqft
$850/mo
Dist: 1.08 mi
2
1
800 sqft
$800/mo
Dist: 1.08 mi
2
1
800 sqft
$875/mo
Dist: 1.08 mi
2
1
800 sqft
$750/mo
Dist: 1.09 mi
2
1
649 sqft
$800/mo
Dist: 1.12 mi
2
1
720 sqft
$800/mo
Dist: 1.12 mi
2
1
720 sqft
$795/mo
Dist: 1.18 mi
2
1
700 sqft
$895/mo
Dist: 1.21 mi
2
1
720 sqft
$895/mo
Dist: 1.21 mi
2
1
720 sqft
$825/mo
Dist: 1.24 mi
2
1
788 sqft
$825/mo
Dist: 1.24 mi
2
1
788 sqft
$750/mo
Dist: 1.27 mi
2
1
712 sqft
$730/mo
Dist: 1.27 mi
2
1
760 sqft
$800/mo
Dist: 1.27 mi
2
1
760 sqft
$700/mo
Dist: 1.32 mi
2
1
620 sqft
$1,050/mo
Dist: 1.32 mi
2
1
768 sqft
$1,050/mo
Dist: 1.32 mi
2
1
768 sqft
$895/mo
Dist: 1.33 mi
2
1
720 sqft
$895/mo
Dist: 1.33 mi
2
1
720 sqft
$725/mo
Dist: 1.4 mi
2
1
800 sqft
$750/mo
Dist: 1.42 mi
2
1
796 sqft
$900/mo
Dist: 1.43 mi
2
1
720 sqft
$900/mo
Dist: 1.43 mi
2
1
720 sqft
$995/mo
Dist: 1.46 mi
2
1
696 sqft
$800/mo
Dist: 1.46 mi
2
1
768 sqft
$700/mo
Dist: 1.5 mi
2
1
720 sqft
$875/mo
Dist: 1.59 mi
2
1
820 sqft
$825/mo
Dist: 1.77 mi
2
1
781 sqft
$775/mo
Dist: 1.77 mi
2
1
781 sqft
$800/mo
Dist: 2.6 mi
2
1
720 sqft
$800/mo
Dist: 2.6 mi
2
1
720 sqft
$800/mo
Dist: 2.82 mi
2
1
700 sqft
$825/mo
Dist: 3.05 mi
2
1
728 sqft
$825/mo
Dist: 3.05 mi
2
1
728 sqft
$600/mo
Dist: 4.62 mi
2
1
800 sqft
$800/mo
Dist: 4.7 mi
2
1
700 sqft
$999/mo
Dist: 4.79 mi
2
1
825 sqft
$795/mo
Dist: 20.94 mi
2
1
800 sqft