
Luna - Real Estate AI Assistant
Get insights, projections, and answers instantly!
POWERED BY 
Get insights, projections, and answers instantly!
POWERED BY
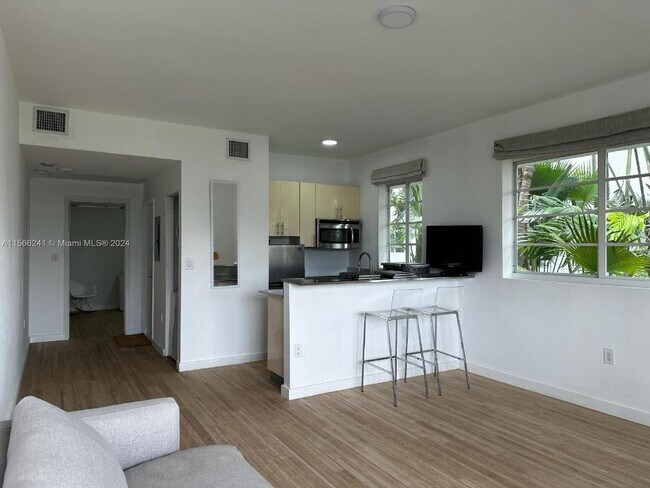
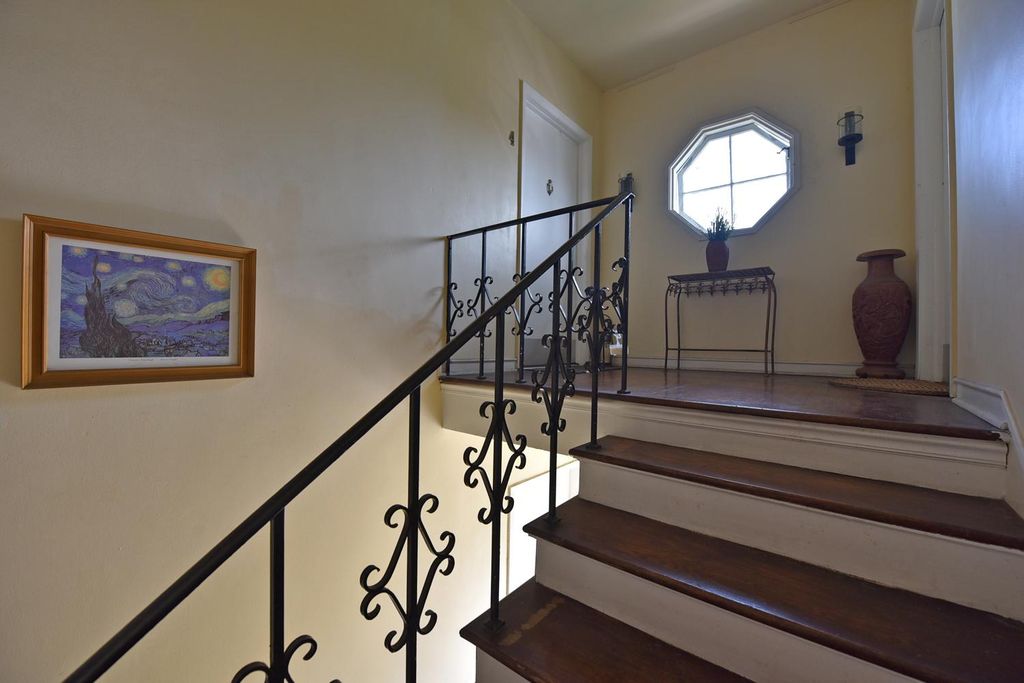
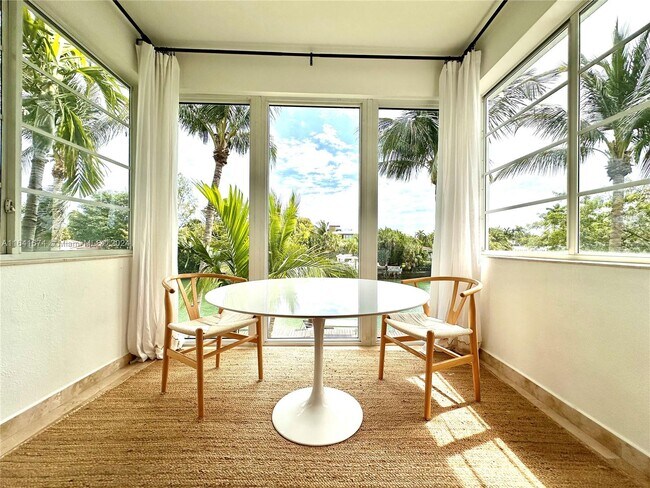
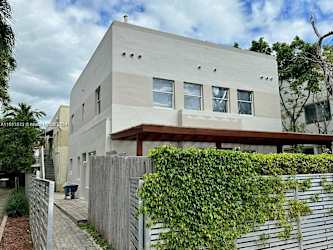
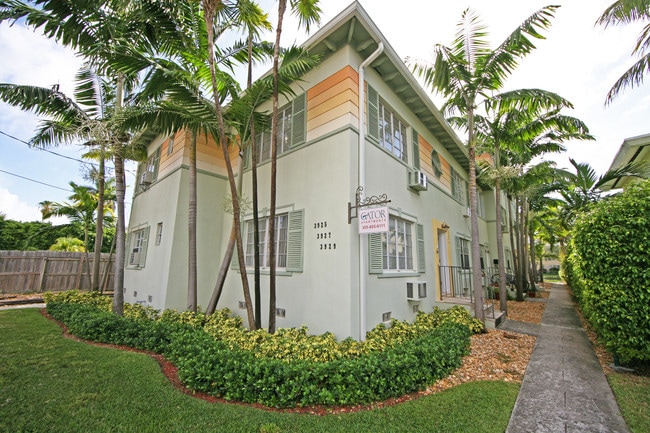
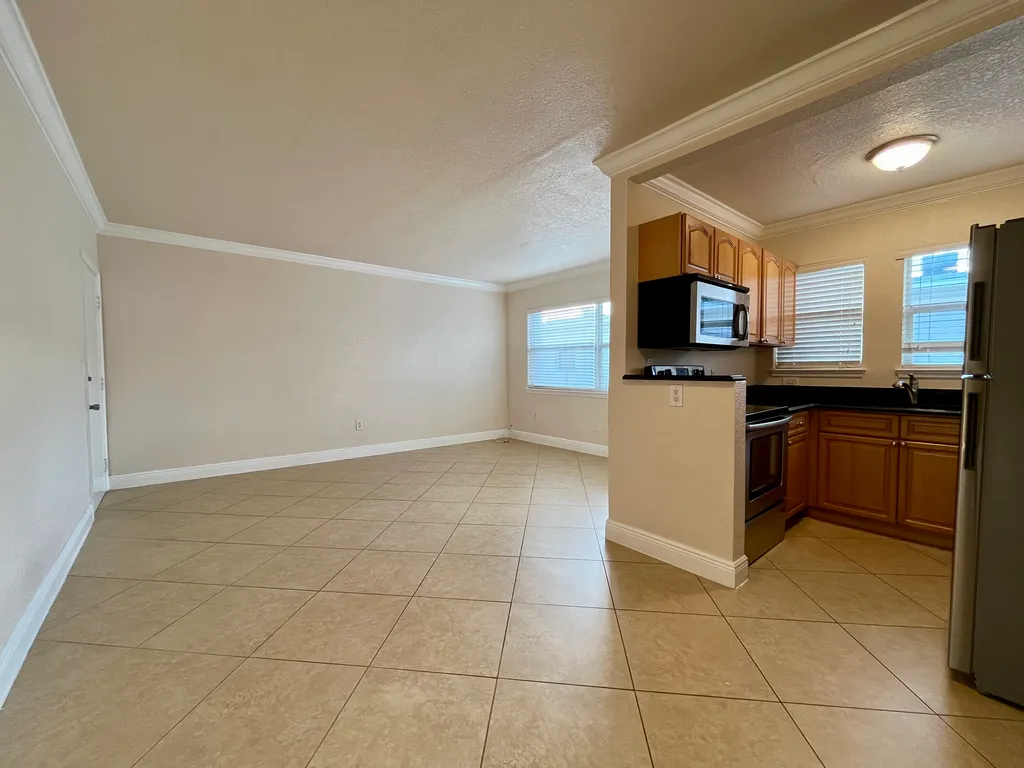
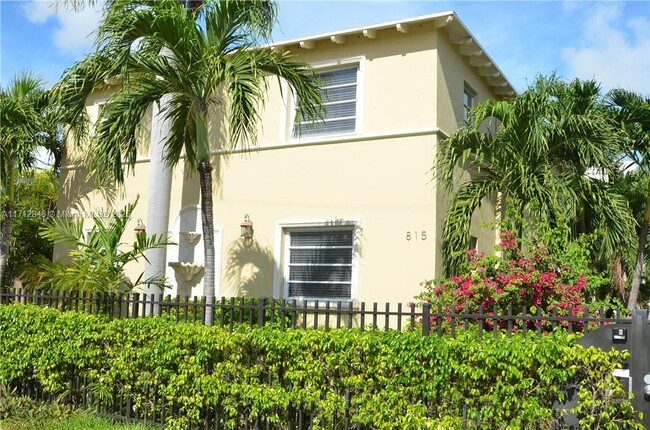
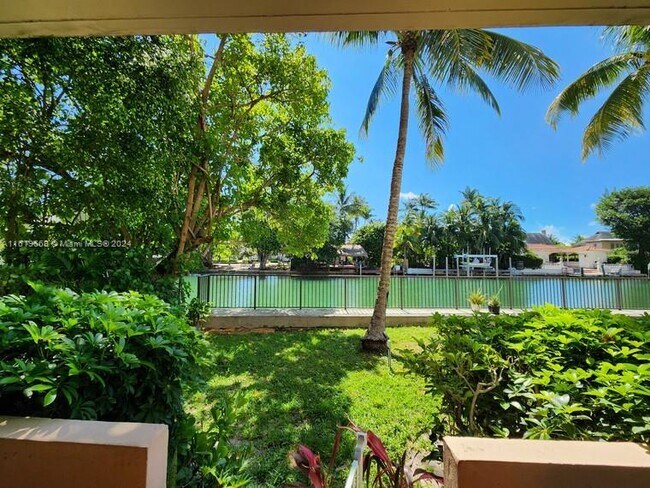
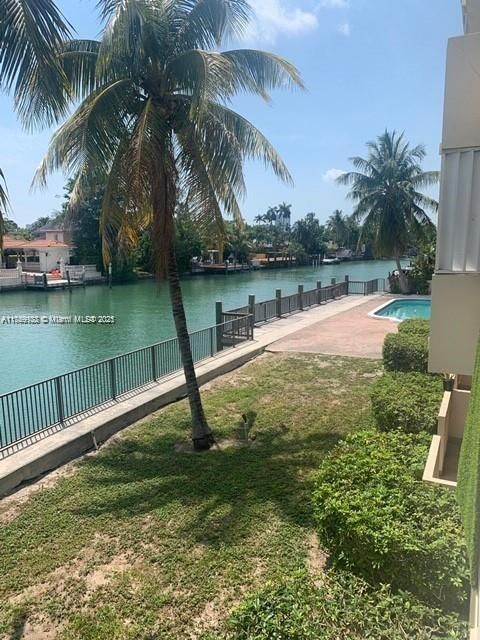
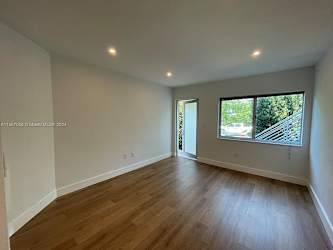
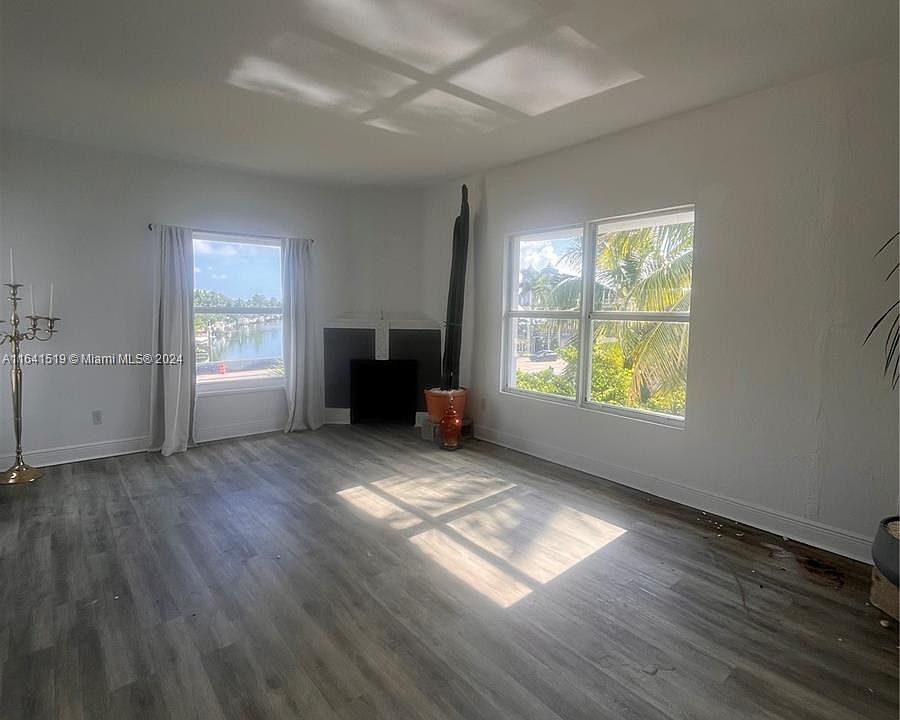
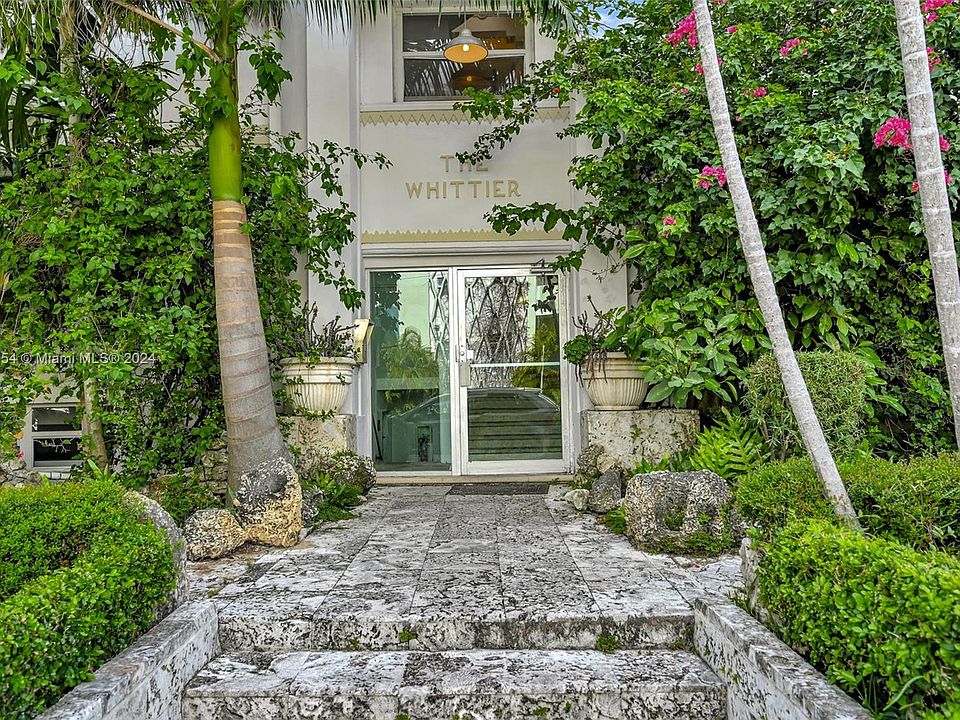
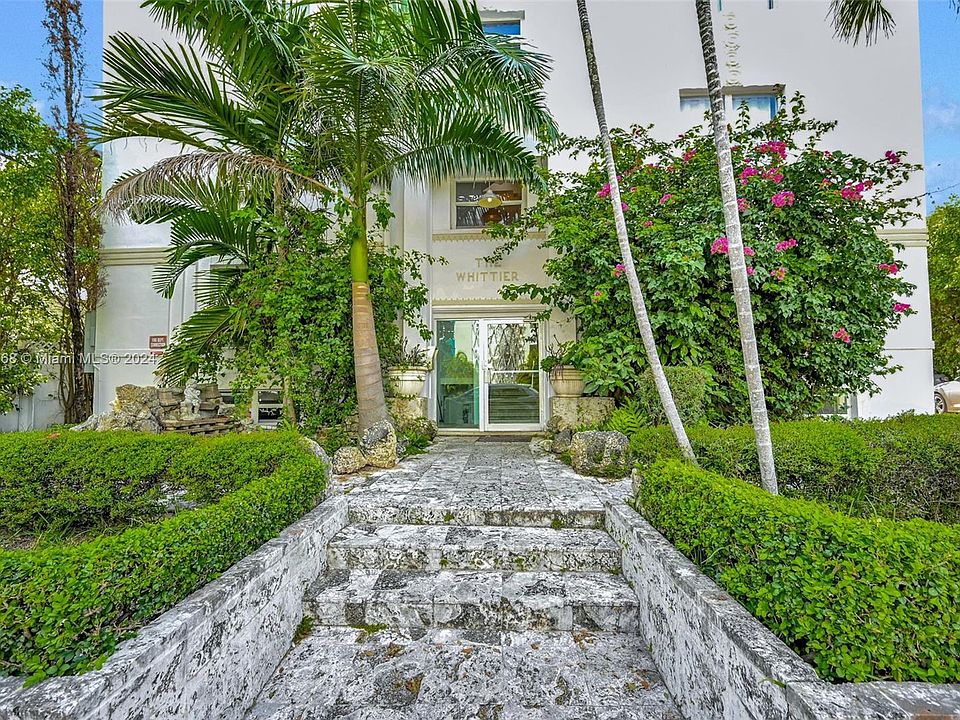
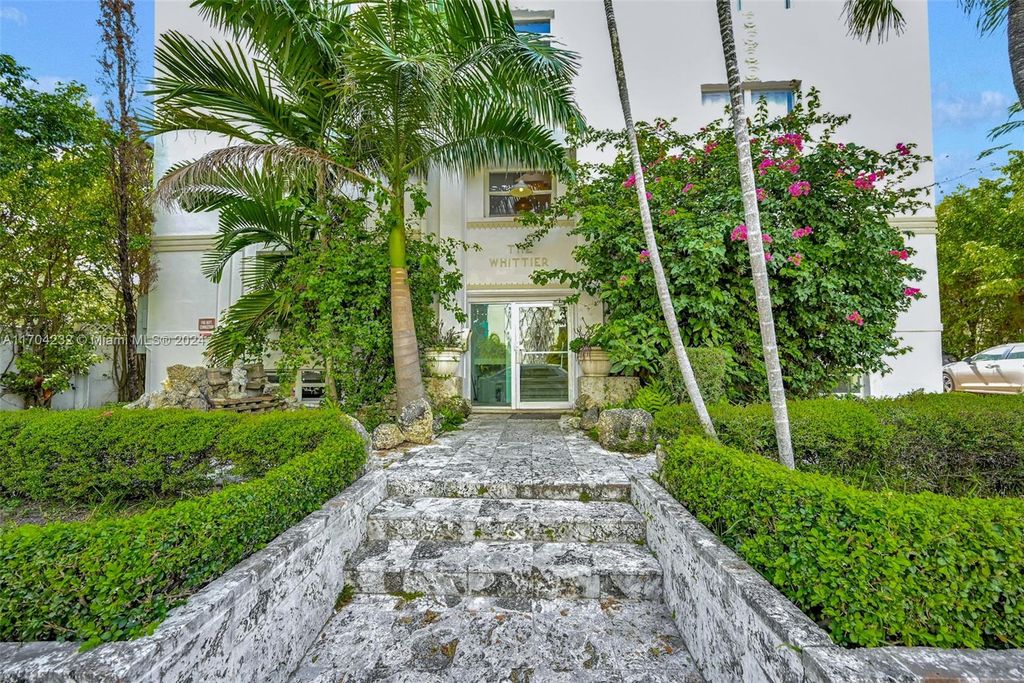
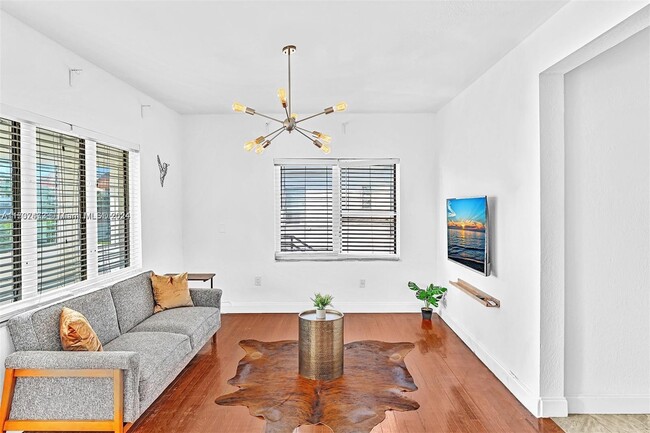
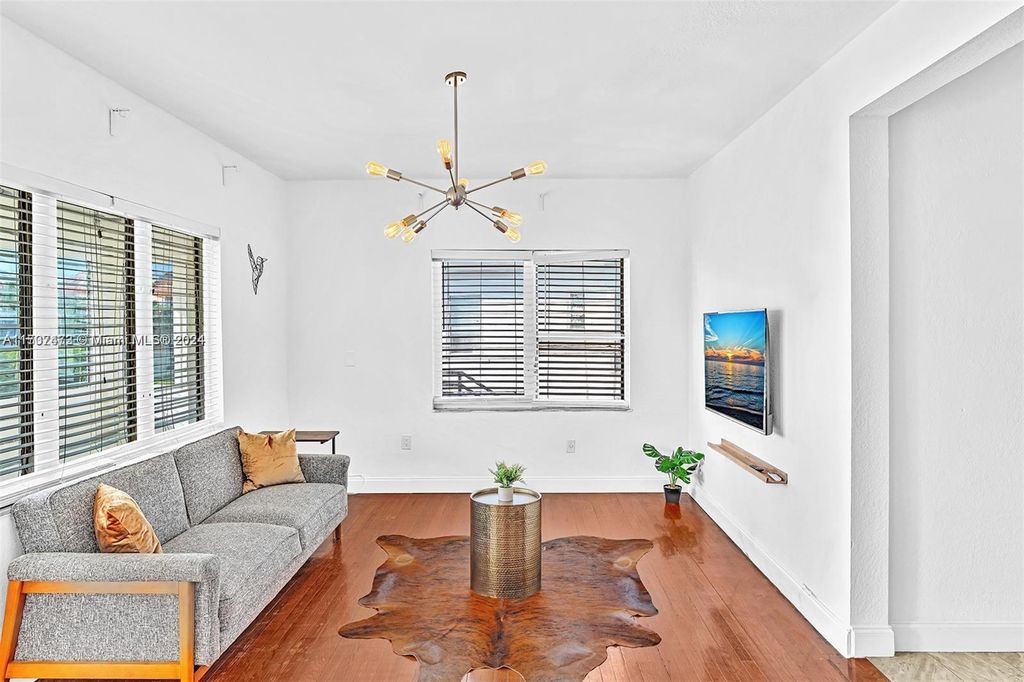
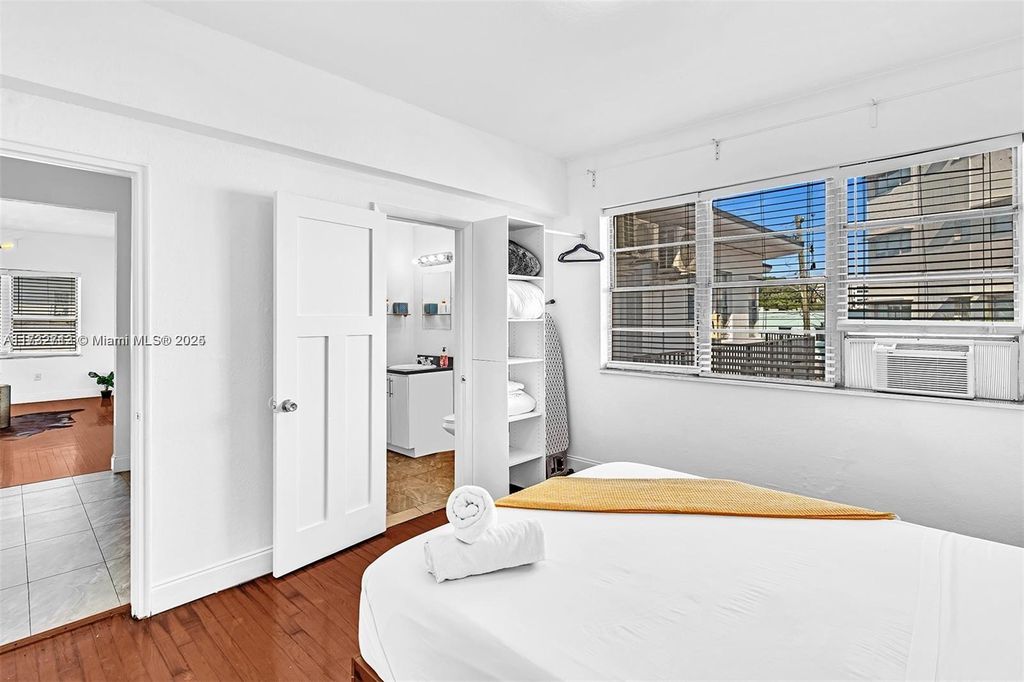
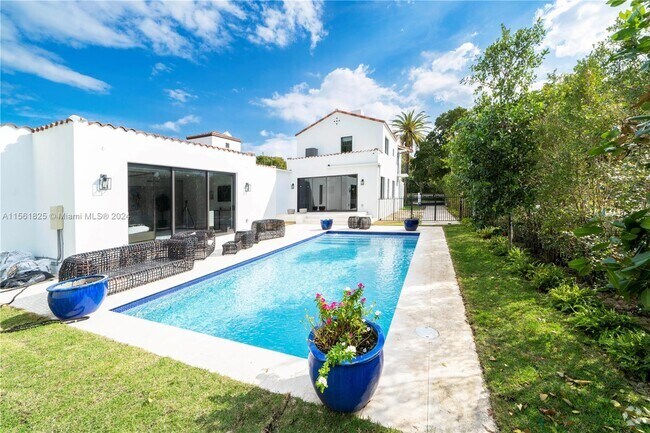
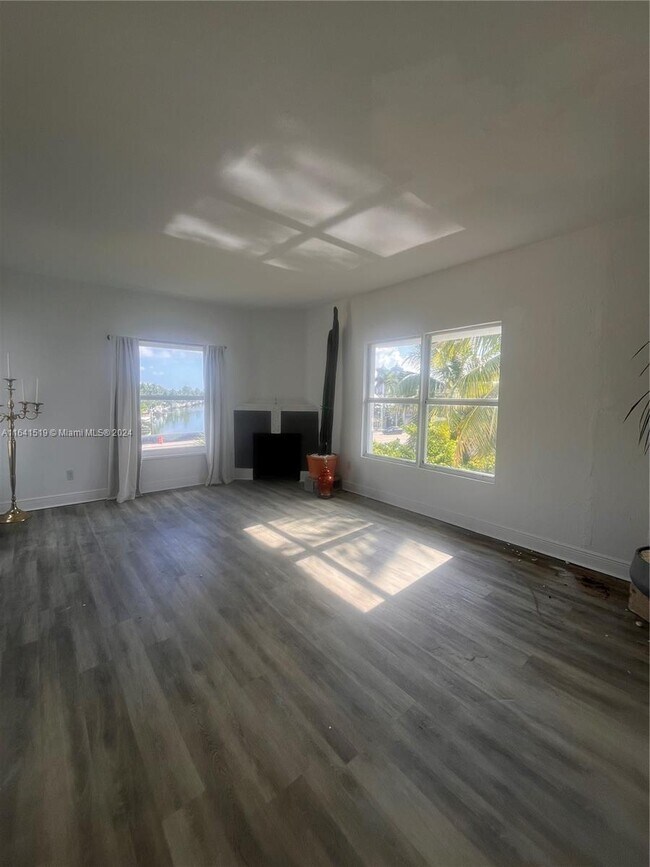
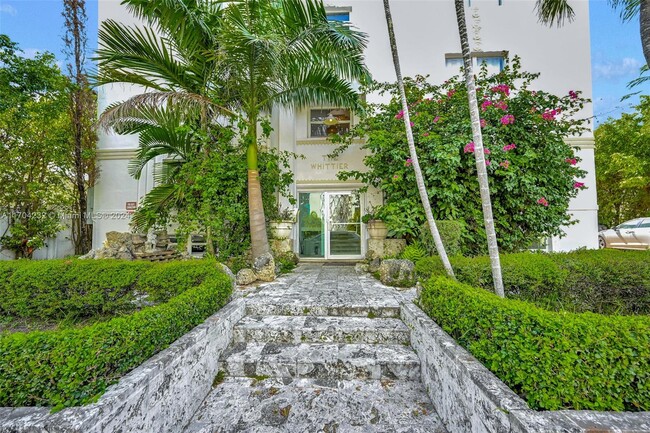
Investment Opportunity: Off-Market Listing: Resideline estimates that this property can be rented long-term for an average of $2,205 per month, based on comparable local listings. Estimated long-term cap rate of -2.4%. Welcome to The Waterclub Condo. This unit has been tastefully renovated and is flooded with natural light. Unit is amongst the few with a private yard while also offering access to the canal. Property is lined with trees for shade and privacy.
Monthly Rent | $2,205 |
Monthly HOA | $534 |
Rental Policy | STR Restrictions |
Yearly Taxes | $4229 |
Bedrooms | 1 |
Bathrooms | 1 |
SQFT | 600 |
Furnished | N/A |
Year built | 1940 |
Listing Status | Off Market |
MLS | A11594174 |
Interest rate
Let’s analyze a 30-year fixed-rate mortgage for $400,000 at today’s interest rate of 0.07%.
The initial loan size, equal to your condo price: $400,000.
The monthly cost of borrowing, based on an annual rate of 0.07% (divided by 12).
Over 30 years, you’ll make 360 payments (30 years × 12 months).
Estimated monthly Homeowner Association fees: $534.
Yearly taxes of $4229, divided by 12 for a monthly estimate.
Combining principal, interest, payments, HOA fees, and taxes, your approximate yearly mortgage expenses are $36,180.
The capitalization (cap) rate measures a property’s rate of return based on its income. It’s calculated by dividing the Net Operating Income (NOI) by the Current Market Value, expressed as a percentage.
The income after operating expenses (e.g., management, maintenance, insurance), calculated as gross rental income minus these costs: $-9,720.
The estimated property value based on recent sales of similar properties: $400,000.
For a property with an NOI of $-9,720 per year and a market value of $400,000:
Formula: NOI / Current Market Value
$-9,720 / $400,000 = -2.4%
The capitalization (cap) rate measures a property’s rate of return based on its income. For short-term rentals, it’s calculated by dividing the Net Operating Income (NOI) by the Current Market Value, expressed as a percentage.
The income after operating expenses (e.g., management, maintenance, insurance), calculated as gross rental income minus these costs: $-36,180.
The estimated property value based on recent sales of similar properties: $400,000.
For a property with an NOI of $-36,180 per year and a market value of $400,000:
Formula: NOI / Current Market Value
$-36,180 / $400,000 = -9.0%
Interest rate
Cash on Cash Return is a key real estate metric that measures the annual cash income earned relative to the cash invested, expressed as a percentage. It’s calculated by dividing the Annual Pre-Tax Cash Flow by the Total Cash Invested.
The property’s yearly income after operating expenses, excluding financing costs.
Includes your down payment plus additional costs like closing fees.
For a property priced at $400,000 with a 20% down payment and 3% closing costs, and an annual pre-tax cash flow of $-9,720:
Formula: Annual Pre-Tax Cash Flow / Total Cash Invested
$-9,720 / ($400,000 × 0.2 + $400,000 × 0.03) = -10.6%
Cash on Cash Return measures the annual cash income earned from a property relative to the cash invested, expressed as a percentage. For short-term rentals, it’s calculated by dividing the Annual Pre-Tax Cash Flow by the Total Cash Invested.
The property’s yearly income after operating expenses, excluding financing costs.
Includes your down payment plus additional costs like closing fees.
For a property priced at $400,000 with a 20% down payment and 3% closing costs, and an annual pre-tax cash flow of $-36,180:
Formula: Annual Pre-Tax Cash Flow / Total Cash Invested
$-36,180 / ($400,000 × 0.2 + $400,000 × 0.03) = -39.3%
Here’s how we calculate your potential yearly revenue for short-term rentals:
We start with 365 days, the total number of days in a year.
The percentage of the year your property is rented out: Hidden%.
Calculated as 365 days × occupancy rate (Hidden%).
The amount charged per day: Hidden.
Rented days × daily rental rate.

Typically 3% of rental income, plus additional fees like HOA or property-specific costs.
Gross rental income minus fees: $0.
Using the rented days, daily rental rate, and applicable fees, your potential yearly revenue is approximately:
$0
Note: Some properties may have additional short-term rental fees (e.g., 15% at Club at Brickell, Edgewater, Miami), which are included in this calculation.
Monthly Rent Revenue
Yearly Rent Revenue
*Estimate based on similar properties in the area.
57 Comparable listings
$2,800/mo
Dist: 0.0 mi
1
1
600 sqft

$3,200/mo
Dist: 0.0 mi
1
1
716 sqft

$2,400/mo
Dist: 0.01 mi
1
1
648 sqft
$2,000/mo
Dist: 0.01 mi
1
1
550 sqft
$2,500/mo
Dist: 0.03 mi
1
1
600 sqft
$2,400/mo
Dist: 0.03 mi
1
1
600 sqft
$2,800/mo
Dist: 0.03 mi
1
1
600 sqft
$3,000/mo
Dist: 0.03 mi
1
1
709 sqft
$2,600/mo
Dist: 0.03 mi
1
1
648 sqft
$3,200/mo
Dist: 0.03 mi
1
1
716 sqft
$3,200/mo
Dist: 0.03 mi
1
1
716 sqft
$1,900/mo
Dist: 0.03 mi
1
1
680 sqft
$1,800/mo
Dist: 0.03 mi
1
1
500 sqft

$2,250/mo
Dist: 0.03 mi
1
1
680 sqft
$2,000/mo
Dist: 0.04 mi
1
1
500 sqft
$2,000/mo
Dist: 0.04 mi
1
1
500 sqft
$1,950/mo
Dist: 0.04 mi
1
1
500 sqft

$1,900/mo
Dist: 0.04 mi
1
1
500 sqft
$1,800/mo
Dist: 0.05 mi
1
1
600 sqft
$2,100/mo
Dist: 0.05 mi
1
1
650 sqft
$2,050/mo
Dist: 0.05 mi
1
1
697 sqft
$2,200/mo
Dist: 0.06 mi
1
1
680 sqft
$2,200/mo
Dist: 0.06 mi
1
1
680 sqft
$2,000/mo
Dist: 0.06 mi
1
1
680 sqft
$2,000/mo
Dist: 0.06 mi
1
1
680 sqft
$2,300/mo
Dist: 0.06 mi
1
1
680 sqft

$1,800/mo
Dist: 0.06 mi
1
1
680 sqft
$2,250/mo
Dist: 0.06 mi
1
1
680 sqft
$2,400/mo
Dist: 0.07 mi
1
1
581 sqft
$2,300/mo
Dist: 0.07 mi
1
1
568 sqft

$2,098/mo
Dist: 0.07 mi
1
1
710 sqft
$2,400/mo
Dist: 0.07 mi
1
1
586 sqft
$2,200/mo
Dist: 0.07 mi
1
1
586 sqft
$2,398/mo
Dist: 0.07 mi
1
1
700 sqft
$2,098/mo
Dist: 0.08 mi
1
1
650 sqft

$2,198/mo
Dist: 0.08 mi
1
1
700 sqft
$1,798/mo
Dist: 0.08 mi
1
1
550 sqft
$1,848/mo
Dist: 0.08 mi
1
1
600 sqft
$2,100/mo
Dist: 0.09 mi
1
1
699 sqft
$2,150/mo
Dist: 0.09 mi
1
1
700 sqft
$1,950/mo
Dist: 0.09 mi
1
1
700 sqft
$1,850/mo
Dist: 0.09 mi
1
1
700 sqft
$1,898/mo
Dist: 0.1 mi
1
1
580 sqft

$1,998/mo
Dist: 0.1 mi
1
1
700 sqft
$2,498/mo
Dist: 0.1 mi
1
1
715 sqft

$2,098/mo
Dist: 0.1 mi
1
1
710 sqft
$1,898/mo
Dist: 0.1 mi
1
1
700 sqft
$2,098/mo
Dist: 0.1 mi
1
1
710 sqft
$2,098/mo
Dist: 0.1 mi
1
1
650 sqft
$2,098/mo
Dist: 0.1 mi
1
1
650 sqft
$2,398/mo
Dist: 0.1 mi
1
1
700 sqft
$2,398/mo
Dist: 0.1 mi
1
1
700 sqft
$2,198/mo
Dist: 0.1 mi
1
1
700 sqft
$2,198/mo
Dist: 0.1 mi
1
1
700 sqft
$1,798/mo
Dist: 0.1 mi
1
1
550 sqft

$1,798/mo
Dist: 0.1 mi
1
1
550 sqft
$1,848/mo
Dist: 0.1 mi
1
1
600 sqft


