
Luna - Real Estate AI Assistant
Get insights, projections, and answers instantly!
POWERED BY 
Get insights, projections, and answers instantly!
POWERED BY
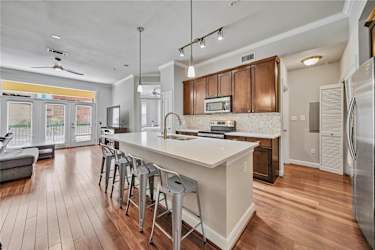
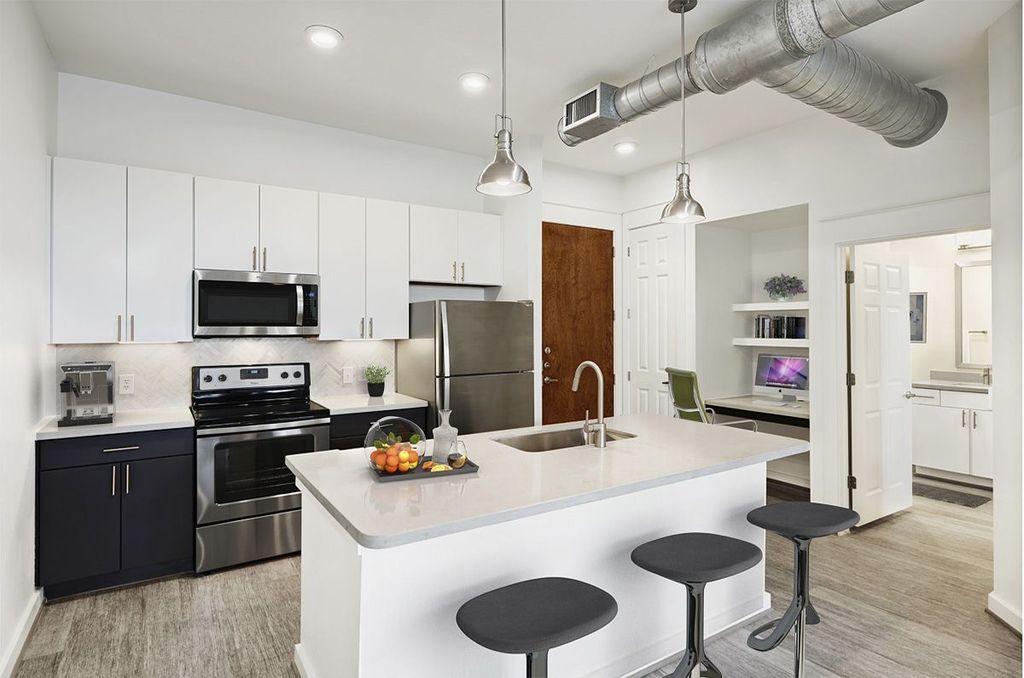
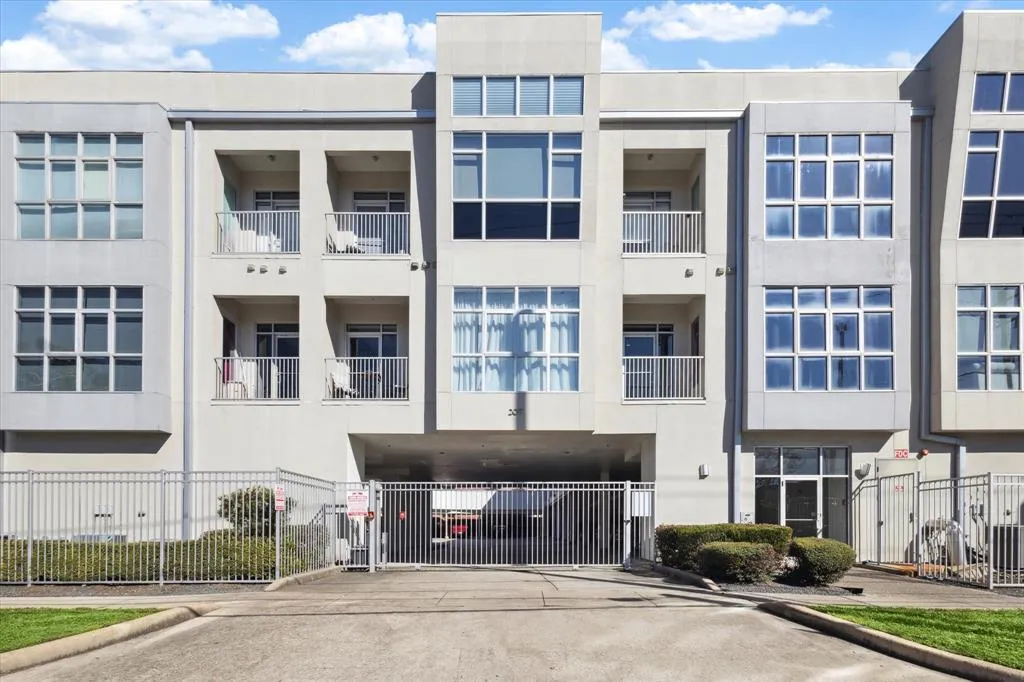
Investment Opportunity: Off-Market Listing: Resideline estimates that this property can be rented on Airbnb for an average of $95 per day and long-term for an average of $1,546 per month, based on similar listings in the area. Estimated short-term cap rate of -1.2%. Estimated long-term cap rate of -2.6%. Welcome to 300 St Joseph! This fantastic Mid/Hi-Rise Condo boasts 1 bedroom, 1 bathroom, and 946 square feet of living space. Built in 2006, this property offers modern amenities and a convenient location. Don't miss out on the opportunity to own this lovely home! Contact me for more details.
Airbnb Avg Daily | See Full Details |
Occupancy Rate | See Full Details |
Monthly HOA | $581 |
Rental Policy | daily |
Yearly Taxes | $4033 |
Bedrooms | 1 |
Bathrooms | 1 |
SQFT | 946 |
Furnished | N/A |
Year built | 2006 |
Listing Status | Off Market |
MLS | 11025477 |
Interest rate
Let’s analyze a 30-year fixed-rate mortgage for $199,999 at today’s interest rate of 0.07%.
The initial loan size, equal to your condo price: $199,999.
The monthly cost of borrowing, based on an annual rate of 0.07% (divided by 12).
Over 30 years, you’ll make 360 payments (30 years × 12 months).
Estimated monthly Homeowner Association fees: $581.
Yearly taxes of $4033, divided by 12 for a monthly estimate.
Combining principal, interest, payments, HOA fees, and taxes, your approximate yearly mortgage expenses are $23,772.
The capitalization (cap) rate measures a property’s rate of return based on its income. It’s calculated by dividing the Net Operating Income (NOI) by the Current Market Value, expressed as a percentage.
The income after operating expenses (e.g., management, maintenance, insurance), calculated as gross rental income minus these costs: $-5,220.
The estimated property value based on recent sales of similar properties: $199,999.
For a property with an NOI of $-5,220 per year and a market value of $199,999:
Formula: NOI / Current Market Value
$-5,220 / $199,999 = -2.6%
The capitalization (cap) rate measures a property’s rate of return based on its income. For short-term rentals, it’s calculated by dividing the Net Operating Income (NOI) by the Current Market Value, expressed as a percentage.
The income after operating expenses (e.g., management, maintenance, insurance), calculated as gross rental income minus these costs: $-2,340.
The estimated property value based on recent sales of similar properties: $199,999.
For a property with an NOI of $-2,340 per year and a market value of $199,999:
Formula: NOI / Current Market Value
$-2,340 / $199,999 = -1.2%
Interest rate
Cash on Cash Return is a key real estate metric that measures the annual cash income earned relative to the cash invested, expressed as a percentage. It’s calculated by dividing the Annual Pre-Tax Cash Flow by the Total Cash Invested.
The property’s yearly income after operating expenses, excluding financing costs.
Includes your down payment plus additional costs like closing fees.
For a property priced at $199,999 with a 20% down payment and 3% closing costs, and an annual pre-tax cash flow of $-5,220:
Formula: Annual Pre-Tax Cash Flow / Total Cash Invested
$-5,220 / ($199,999 × 0.2 + $199,999 × 0.03) = -11.3%
Cash on Cash Return measures the annual cash income earned from a property relative to the cash invested, expressed as a percentage. For short-term rentals, it’s calculated by dividing the Annual Pre-Tax Cash Flow by the Total Cash Invested.
The property’s yearly income after operating expenses, excluding financing costs.
Includes your down payment plus additional costs like closing fees.
For a property priced at $199,999 with a 20% down payment and 3% closing costs, and an annual pre-tax cash flow of $-2,340:
Formula: Annual Pre-Tax Cash Flow / Total Cash Invested
$-2,340 / ($199,999 × 0.2 + $199,999 × 0.03) = -5.1%
Here’s how we calculate your potential yearly revenue for short-term rentals:
We start with 365 days, the total number of days in a year.
The percentage of the year your property is rented out: Hidden%.
Calculated as 365 days × occupancy rate (Hidden%).
The amount charged per day: Hidden.
Rented days × daily rental rate.

Typically 3% of rental income, plus additional fees like HOA or property-specific costs.
Gross rental income minus fees: $21,432.
Using the rented days, daily rental rate, and applicable fees, your potential yearly revenue is approximately:
$21,432
Note: Some properties may have additional short-term rental fees (e.g., 15% at Club at Brickell, Edgewater, Miami), which are included in this calculation.
Monthly Rent Revenue
Yearly Rent Revenue
*Estimate based on similar properties in the area.
69 Comparable listings
$1,550/mo
Dist: 0.0 mi
1
1
1015 sqft
$1,950/mo
Dist: 0.0 mi
1
1
1015 sqft
$1,900/mo
Dist: 0.0 mi
1
1
1015 sqft

$1,950/mo
Dist: 0.0 mi
1
1
1015 sqft
$1,519/mo
Dist: 0.04 mi
1
1
824 sqft
$1,569/mo
Dist: 0.04 mi
1
1
824 sqft
$1,579/mo
Dist: 0.04 mi
1
1
824 sqft
$1,429/mo
Dist: 0.04 mi
1
1
824 sqft
$1,599/mo
Dist: 0.04 mi
1
1
865 sqft
$1,469/mo
Dist: 0.04 mi
1
1
865 sqft
$1,559/mo
Dist: 0.04 mi
1
1
865 sqft
$1,549/mo
Dist: 0.04 mi
1
1
865 sqft
$1,619/mo
Dist: 0.04 mi
1
1
879 sqft
$1,419/mo
Dist: 0.04 mi
1
1
879 sqft
$1,409/mo
Dist: 0.04 mi
1
1
879 sqft
$1,549/mo
Dist: 0.04 mi
1
1
911 sqft
$1,569/mo
Dist: 0.04 mi
1
1
911 sqft
$1,539/mo
Dist: 0.04 mi
1
1
911 sqft
$1,509/mo
Dist: 0.04 mi
1
1
911 sqft
$1,479/mo
Dist: 0.04 mi
1
1
911 sqft
$1,529/mo
Dist: 0.04 mi
1
1
922 sqft
$1,419/mo
Dist: 0.04 mi
1
1
922 sqft
$1,589/mo
Dist: 0.04 mi
1
1
945 sqft
$1,619/mo
Dist: 0.04 mi
1
1
945 sqft
$1,569/mo
Dist: 0.04 mi
1
1
958 sqft
$1,519/mo
Dist: 0.04 mi
1
1
965 sqft
$1,439/mo
Dist: 0.04 mi
1
1
977 sqft
$1,569/mo
Dist: 0.04 mi
1
1
977 sqft
$1,619/mo
Dist: 0.04 mi
1
1
977 sqft
$1,519/mo
Dist: 0.04 mi
1
1
977 sqft
$1,619/mo
Dist: 0.04 mi
1
1
988 sqft
$1,809/mo
Dist: 0.04 mi
1
1
988 sqft
$1,629/mo
Dist: 0.04 mi
1
1
1012 sqft
$1,649/mo
Dist: 0.04 mi
1
1
1026 sqft
$1,629/mo
Dist: 0.04 mi
1
1
1026 sqft
$1,549/mo
Dist: 0.04 mi
1
1
1026 sqft
$1,729/mo
Dist: 0.04 mi
1
1
1075 sqft
$1,759/mo
Dist: 0.04 mi
1
1
1075 sqft
$1,492/mo
Dist: 0.05 mi
1
1
788 sqft
$1,475/mo
Dist: 0.05 mi
1
1
828 sqft
$1,474/mo
Dist: 0.05 mi
1
1
829 sqft

$1,495/mo
Dist: 0.05 mi
1
1
846 sqft
$1,500/mo
Dist: 0.06 mi
1
1
841 sqft
$1,350/mo
Dist: 0.06 mi
1
1
1029 sqft
$2,300/mo
Dist: 0.06 mi
1
1
1035 sqft
$1,248/mo
Dist: 0.11 mi
1
1
764 sqft
$1,526/mo
Dist: 0.11 mi
1
1
770 sqft
$1,423/mo
Dist: 0.11 mi
1
1
770 sqft

$1,350/mo
Dist: 0.11 mi
1
1
779 sqft
$1,223/mo
Dist: 0.11 mi
1
1
779 sqft
$1,385/mo
Dist: 0.11 mi
1
1
786 sqft
$1,255/mo
Dist: 0.11 mi
1
1
795 sqft
$1,286/mo
Dist: 0.11 mi
1
1
795 sqft
$1,195/mo
Dist: 0.11 mi
1
1
802 sqft
$1,220/mo
Dist: 0.11 mi
1
1
802 sqft
$1,325/mo
Dist: 0.11 mi
1
1
812 sqft
$1,441/mo
Dist: 0.11 mi
1
1
826 sqft
$1,425/mo
Dist: 0.11 mi
1
1
837 sqft
$1,514/mo
Dist: 0.11 mi
1
1
837 sqft
$1,321/mo
Dist: 0.11 mi
1
1
850 sqft
$1,378/mo
Dist: 0.11 mi
1
1
850 sqft
$1,290/mo
Dist: 0.11 mi
1
1
870 sqft
$1,389/mo
Dist: 0.11 mi
1
1
885 sqft
$1,394/mo
Dist: 0.11 mi
1
1
896 sqft
$1,411/mo
Dist: 0.11 mi
1
1
903 sqft
$1,555/mo
Dist: 0.11 mi
1
1
1011 sqft
$2,266/mo
Dist: 0.18 mi
1
1
794 sqft
$2,266/mo
Dist: 0.18 mi
1
1
794 sqft
$2,010/mo
Dist: 0.18 mi
1
1
794 sqft


